
📉🐻 BTC/USDT Daily Chart Analysis – Bearish Breakdown & Reversal Zone
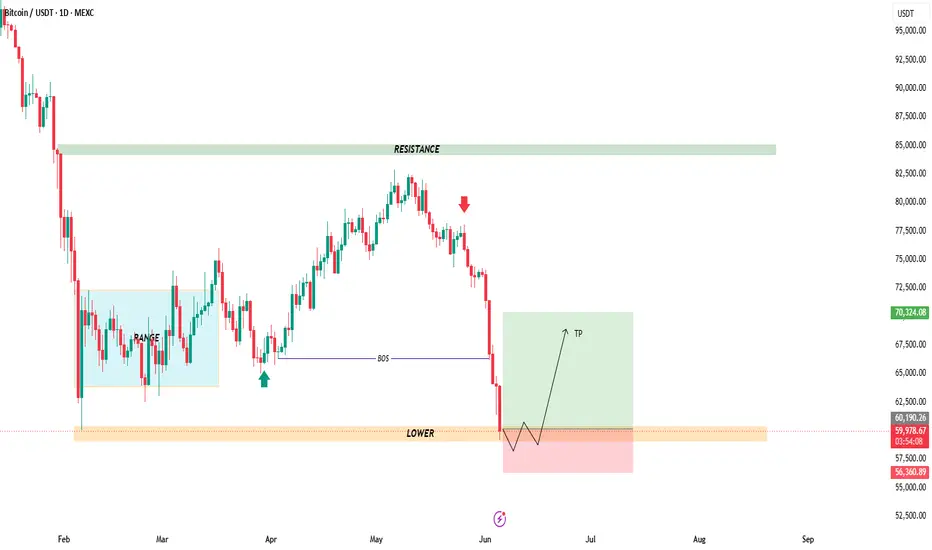
The BTC/USDT daily chart shows a strong bearish market structure after failing to sustain higher prices near the $80K–82K resistance area. Sellers stepped in aggressively, leading to a sharp decline and a break below the previous BOS (Break of Structure) level.
🔍 Key Technical Observations
✅ Major Resistance: $84K–85K zone remains the key supply area where sellers previously rejected price.
✅ Bearish Momentum: Consecutive strong bearish candles indicate high selling pressure and market weakness.
✅ Liquidity Zone Reached: Price has dropped into the highlighted lower support/demand zone around $60K, an area where buyers may attempt to defend.
✅ Potential Reversal Setup: The chart suggests a possible liquidity sweep below support before a bullish recovery. A successful hold above this demand zone could trigger a rebound.
📊 Trading Outlook
🔻 Bearish Scenario: A daily close below the support zone may extend the decline toward $56K–57K.
🔺 Bullish Scenario: If buyers defend the current demand area, BTC could form a base and rally toward $68K–70K, matching the projected target zone.
🎯 Conclusion
The overall trend remains bearish in the short term, but BTC is approaching a critical demand area where a short-term bullish reaction could emerge. Traders should watch for confirmation before entering long positions. 🚀📈
The BTC/USDT daily chart shows a strong bearish market structure after failing to sustain higher prices near the $80K–82K resistance area. Sellers stepped in aggressively, leading to a sharp decline and a break below the previous BOS (Break of Structure) level.
🔍 Key Technical Observations
✅ Major Resistance: $84K–85K zone remains the key supply area where sellers previously rejected price.
✅ Bearish Momentum: Consecutive strong bearish candles indicate high selling pressure and market weakness.
✅ Liquidity Zone Reached: Price has dropped into the highlighted lower support/demand zone around $60K, an area where buyers may attempt to defend.
✅ Potential Reversal Setup: The chart suggests a possible liquidity sweep below support before a bullish recovery. A successful hold above this demand zone could trigger a rebound.
📊 Trading Outlook
🔻 Bearish Scenario: A daily close below the support zone may extend the decline toward $56K–57K.
🔺 Bullish Scenario: If buyers defend the current demand area, BTC could form a base and rally toward $68K–70K, matching the projected target zone.
🎯 Conclusion
The overall trend remains bearish in the short term, but BTC is approaching a critical demand area where a short-term bullish reaction could emerge. Traders should watch for confirmation before entering long positions. 🚀📈
Giao dịch đang hoạt động
📉 **BTCUSDT Trade Update – Bearish Scenario Playing Out** 🎯
✅ Price respected the bearish market structure and broke below key support.
📊 Momentum remains strong to the downside, with sellers firmly in control.
🎯 The trade is moving according to plan and progressing toward the target zone.
🧠 **Patience pays — let the setup work.** 🔥

✦ MARKET STRATEGY SIGNALS ✦ 📊
Smart Money • Price Action • Precision • good entries
📲 Join Telegram: t.me/marketstrategyentry
Smart Money • Price Action • Precision • good entries
📲 Join Telegram: t.me/marketstrategyentry
Bài đăng liên quan
Thông báo miễn trừ trách nhiệm
Thông tin và các ấn phẩm này không nhằm mục đích, và không cấu thành, lời khuyên hoặc khuyến nghị về tài chính, đầu tư, giao dịch hay các loại khác do TradingView cung cấp hoặc xác nhận. Đọc thêm tại Điều khoản Sử dụng.
✦ MARKET STRATEGY SIGNALS ✦ 📊
Smart Money • Price Action • Precision • good entries
📲 Join Telegram: t.me/marketstrategyentry
Smart Money • Price Action • Precision • good entries
📲 Join Telegram: t.me/marketstrategyentry
Bài đăng liên quan
Thông báo miễn trừ trách nhiệm
Thông tin và các ấn phẩm này không nhằm mục đích, và không cấu thành, lời khuyên hoặc khuyến nghị về tài chính, đầu tư, giao dịch hay các loại khác do TradingView cung cấp hoặc xác nhận. Đọc thêm tại Điều khoản Sử dụng.