
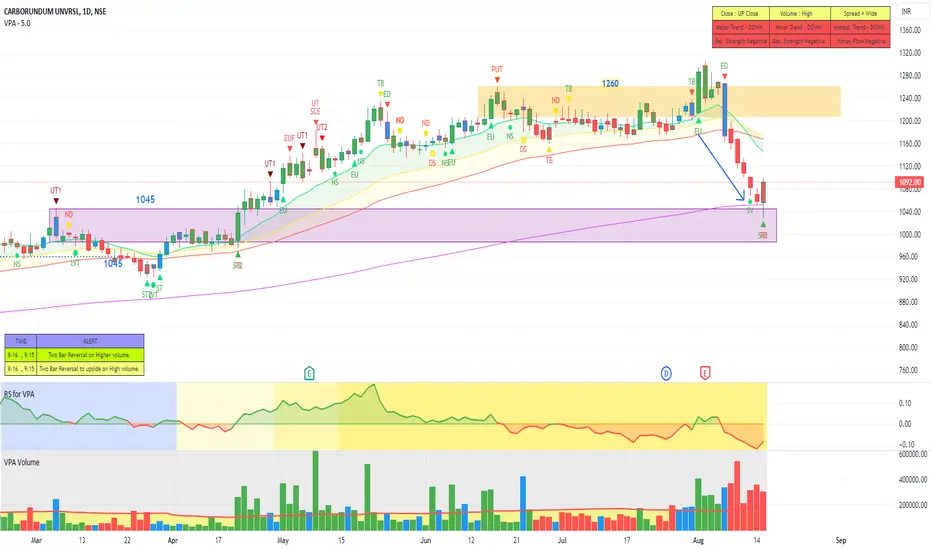
On the chart this looks like a good bounce from the support area and 50 EMA. Look at the candles in the down move. As move proceeded the candle sizes reduced indicating that the momentum was reducing. last candle in the down move was a small spread bar with high volume. This candle is a clear indication the Demand was taking control. The next bar is a bullish one with the long wick, wide spread and closing up. Clear indication that the bulls have taken control. Also, the delivery volumes give a clear indication of Accumulation. The chart indicates a good pull back trading opportunity with a good Risk Reward Ratio.

Thông báo miễn trừ trách nhiệm
Thông tin và các ấn phẩm này không nhằm mục đích, và không cấu thành, lời khuyên hoặc khuyến nghị về tài chính, đầu tư, giao dịch hay các loại khác do TradingView cung cấp hoặc xác nhận. Đọc thêm tại Điều khoản Sử dụng.
Thông báo miễn trừ trách nhiệm
Thông tin và các ấn phẩm này không nhằm mục đích, và không cấu thành, lời khuyên hoặc khuyến nghị về tài chính, đầu tư, giao dịch hay các loại khác do TradingView cung cấp hoặc xác nhận. Đọc thêm tại Điều khoản Sử dụng.