Giá mua
CCCS - Buy
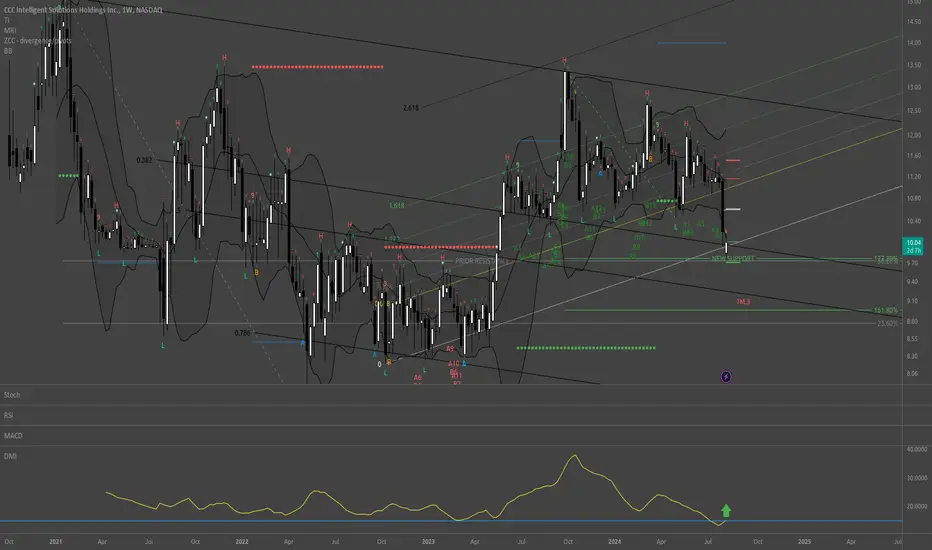
I used TradingView's stock screener to find assets with ADX (14) crossing up 15 on Weekly charts and came upon this CCCS. All of this analysis is based on a Weekly chart. First and foremost this is the first time that ADX is crossing up 15 in the chart's history. Secondly, TD Sequential is on 8/9 of a Buy signal. Third, it's at the bottom of the Bollinger Band. Fourthly, it's at Fibonacci Pivots S2. Lastly, this exact spot is a convergence of several Fibonacci support levels. This looks like the bottom of a coming up trend.
38.20% pullback into Monthly Fibonacci Pivots S2:

38.20% pullback:

127.20% extension support:

Uptrend neared 2.618% extension:

ADX crossing up 15 first time in stock's history:

Bollinger Band lower band:

38.20% pullback into Monthly Fibonacci Pivots S2:
38.20% pullback:
127.20% extension support:
Uptrend neared 2.618% extension:
ADX crossing up 15 first time in stock's history:
Bollinger Band lower band:

Bài đăng liên quan
Thông báo miễn trừ trách nhiệm
Thông tin và các ấn phẩm này không nhằm mục đích, và không cấu thành, lời khuyên hoặc khuyến nghị về tài chính, đầu tư, giao dịch hay các loại khác do TradingView cung cấp hoặc xác nhận. Đọc thêm tại Điều khoản Sử dụng.
Bài đăng liên quan
Thông báo miễn trừ trách nhiệm
Thông tin và các ấn phẩm này không nhằm mục đích, và không cấu thành, lời khuyên hoặc khuyến nghị về tài chính, đầu tư, giao dịch hay các loại khác do TradingView cung cấp hoặc xác nhận. Đọc thêm tại Điều khoản Sử dụng.