
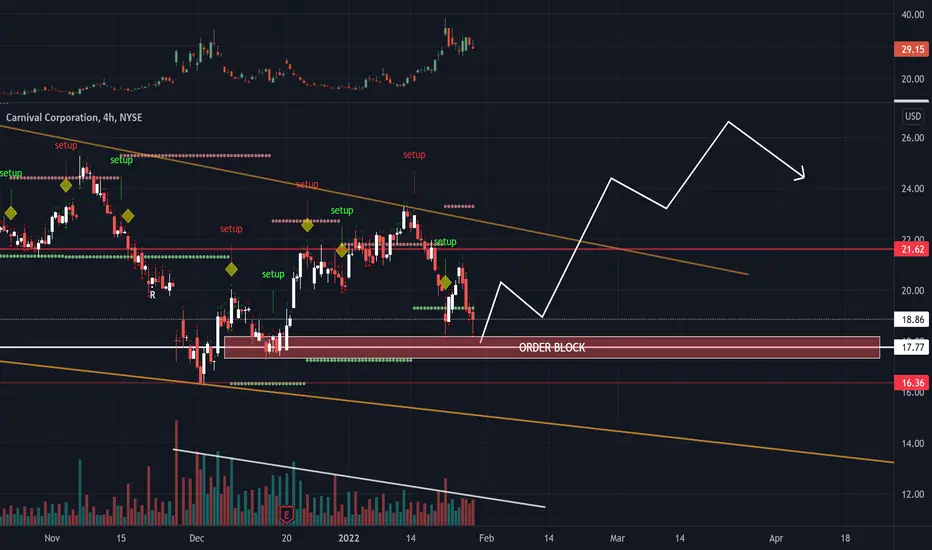
Just some basic technical analysis with the VIX chart at the top of the screen. As you may see, we are seeing a "double Bottom" which is a very bullish chart pattern. In conjunction with the VIX chart and the slowly decreasing Volume, it may be possible to see a reversal here on the next trading day. When we see more market participants buying then it would be safe to assume that there may be a possibility of market reversal.

Thông báo miễn trừ trách nhiệm
Thông tin và các ấn phẩm này không nhằm mục đích, và không cấu thành, lời khuyên hoặc khuyến nghị về tài chính, đầu tư, giao dịch hay các loại khác do TradingView cung cấp hoặc xác nhận. Đọc thêm tại Điều khoản Sử dụng.
Thông báo miễn trừ trách nhiệm
Thông tin và các ấn phẩm này không nhằm mục đích, và không cấu thành, lời khuyên hoặc khuyến nghị về tài chính, đầu tư, giao dịch hay các loại khác do TradingView cung cấp hoặc xác nhận. Đọc thêm tại Điều khoản Sử dụng.