
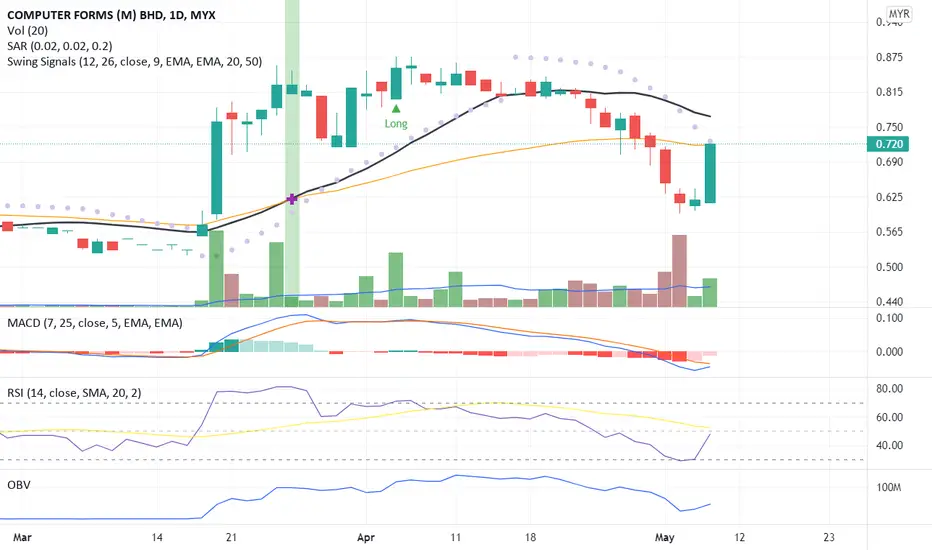
The candlestick body indicate a breakout pattern due to signicant price movement on previous trading where the price croses over the MA50 line. Hence, with probability of begining of uptrend pattern.
The RSI indicates a strong gain momumtum towards indexes 50.
MACD and OBV indicate an early sign of a divergence pattern.
Precaution for a price correction between 10% to 20% from recent price peak before continue with the uptrend momentum.
Let save CFM in WL and watchout for price uptrend movement to next price resistance, the MA20 line.
R 0.770
S 0.635
The RSI indicates a strong gain momumtum towards indexes 50.
MACD and OBV indicate an early sign of a divergence pattern.
Precaution for a price correction between 10% to 20% from recent price peak before continue with the uptrend momentum.
Let save CFM in WL and watchout for price uptrend movement to next price resistance, the MA20 line.
R 0.770
S 0.635

Thông báo miễn trừ trách nhiệm
Thông tin và các ấn phẩm này không nhằm mục đích, và không cấu thành, lời khuyên hoặc khuyến nghị về tài chính, đầu tư, giao dịch hay các loại khác do TradingView cung cấp hoặc xác nhận. Đọc thêm tại Điều khoản Sử dụng.
Thông báo miễn trừ trách nhiệm
Thông tin và các ấn phẩm này không nhằm mục đích, và không cấu thành, lời khuyên hoặc khuyến nghị về tài chính, đầu tư, giao dịch hay các loại khác do TradingView cung cấp hoặc xác nhận. Đọc thêm tại Điều khoản Sử dụng.