
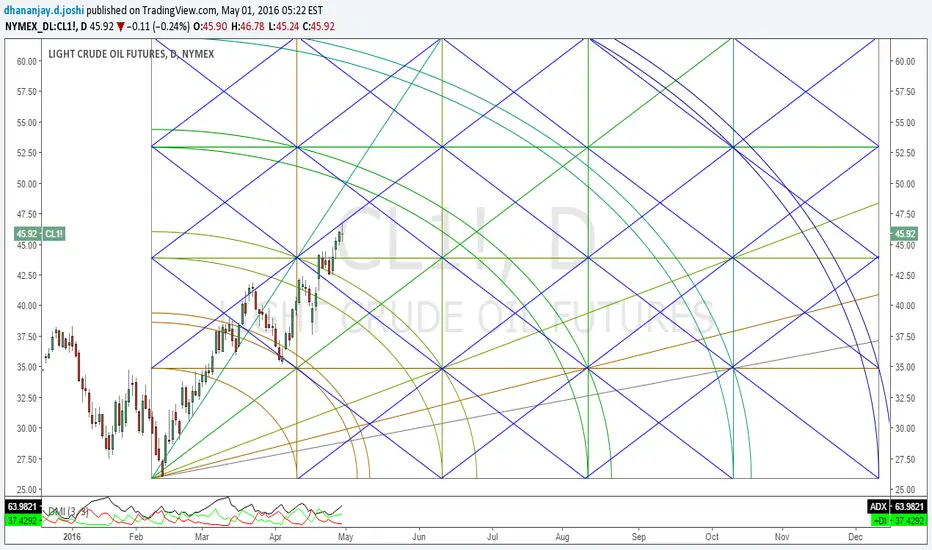
Every line on the chart represents support or resistance.
Vertical lines are time lines where trend may change.
One can use this chart as trading map for next few months. This Gann square-3.00% chart can be used in standalone way or with other trading strategies like. Candle stick patterns, demand supply zones, Momentum indicators, Fibonacci ratios, trend channels or any other way of your own. This chart can be considered as trade conformation chart.
With all kind of tools and charts we are trying to analyse where trend will change, with this or with my any other chart my intention is not to judge top or bottom. With all the tools we will always try to find possible entry exit and stops only.
It is helpful in deciding entry exit and stops.

Bài đăng liên quan
Thông báo miễn trừ trách nhiệm
Thông tin và các ấn phẩm này không nhằm mục đích, và không cấu thành, lời khuyên hoặc khuyến nghị về tài chính, đầu tư, giao dịch hay các loại khác do TradingView cung cấp hoặc xác nhận. Đọc thêm tại Điều khoản Sử dụng.
Bài đăng liên quan
Thông báo miễn trừ trách nhiệm
Thông tin và các ấn phẩm này không nhằm mục đích, và không cấu thành, lời khuyên hoặc khuyến nghị về tài chính, đầu tư, giao dịch hay các loại khác do TradingView cung cấp hoặc xác nhận. Đọc thêm tại Điều khoản Sử dụng.