
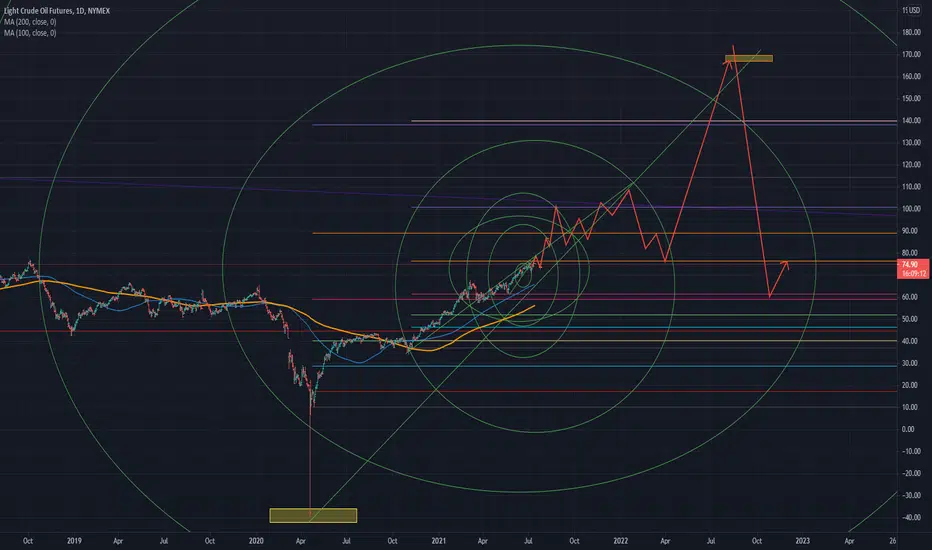
I used Fibonacci circles and used extensions. It is a prediction chart using wave properties. According to this chart, after hitting the $100 range in September of this year and falling, it rises again to $100 in early 2022, and then renews the highest price in 2022 after the decline.
Remember, this is just a personal scenario, not an exact calculation. The choice is yours
Remember, this is just a personal scenario, not an exact calculation. The choice is yours

Thông báo miễn trừ trách nhiệm
Thông tin và các ấn phẩm này không nhằm mục đích, và không cấu thành, lời khuyên hoặc khuyến nghị về tài chính, đầu tư, giao dịch hay các loại khác do TradingView cung cấp hoặc xác nhận. Đọc thêm tại Điều khoản Sử dụng.
Thông báo miễn trừ trách nhiệm
Thông tin và các ấn phẩm này không nhằm mục đích, và không cấu thành, lời khuyên hoặc khuyến nghị về tài chính, đầu tư, giao dịch hay các loại khác do TradingView cung cấp hoặc xác nhận. Đọc thêm tại Điều khoản Sử dụng.