
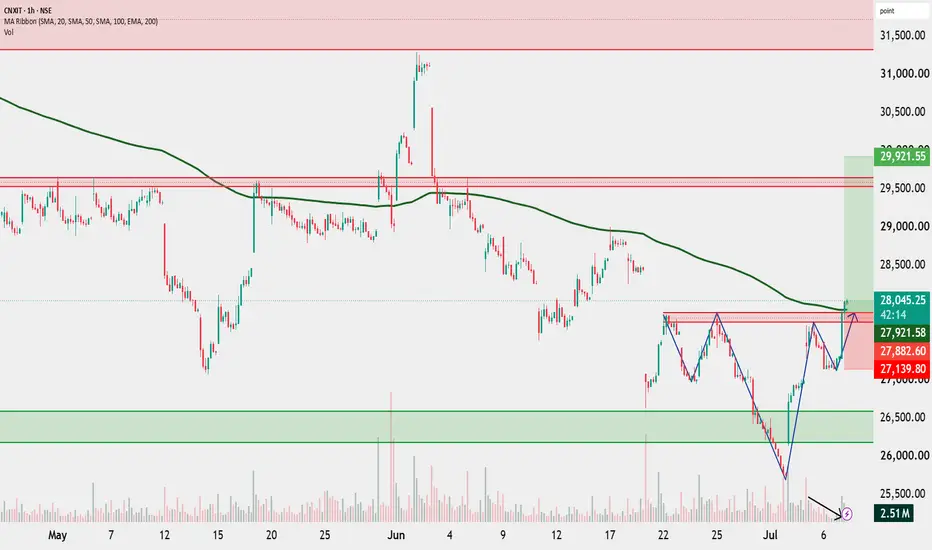
CNX IT is forming an Inverse Head and Shoulder pattern while also showing a bullish market structure with higher highs and higher lows after a Change of Character (ChoCH). Price is testing the neckline and the 200 EMA, making this a crucial resistance zone. A sustained close above 27,900–28,000 would confirm a Break of Structure (BOS) and strengthen the bullish outlook. Volume has declined during the pullback, indicating weak selling pressure. Wait for a confirmed breakout before taking any position.
Disclaimer: For educational purposes only. Not an investment recommendation. Please consult your registered financial advisor. I am only a SEBI Certified Research Analyst.
Disclaimer: For educational purposes only. Not an investment recommendation. Please consult your registered financial advisor. I am only a SEBI Certified Research Analyst.

Bài đăng liên quan
Thông báo miễn trừ trách nhiệm
Thông tin và các ấn phẩm này không nhằm mục đích, và không cấu thành, lời khuyên hoặc khuyến nghị về tài chính, đầu tư, giao dịch hay các loại khác do TradingView cung cấp hoặc xác nhận. Đọc thêm tại Điều khoản Sử dụng.
Bài đăng liên quan
Thông báo miễn trừ trách nhiệm
Thông tin và các ấn phẩm này không nhằm mục đích, và không cấu thành, lời khuyên hoặc khuyến nghị về tài chính, đầu tư, giao dịch hay các loại khác do TradingView cung cấp hoặc xác nhận. Đọc thêm tại Điều khoản Sử dụng.