
Technical Analysis
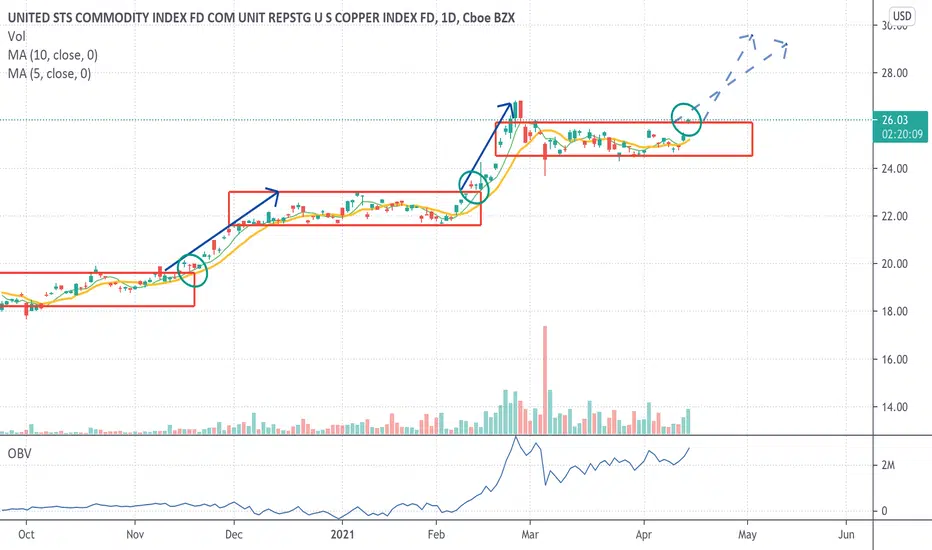
As you can see in the chart, every red square is showing a consolidation period, followed by a strong rally.
Today's action is showing strength as we are seeing a potential breakout, outside the 1-month consolidation period.
Trade setup
The light-blue arrows are potential measured moves. However, I would follow the 5sma or 10sma, as a stop-exit for 50% of your position.
Fundamental Analysis
There is some concern around inflation, all though the Fed maintains he believes it will be transitory.
Here is the way I follow inflation, which is a free chart by the Federal Reserve Economic Data:
fred.stlouisfed.org/series/T5YIE
Another way is with the TIP etf.
Ghi chú
Since the breakout, we have made a test of the last consolidation range and bounce back higher.Chart is looking great.

Bài đăng liên quan
Thông báo miễn trừ trách nhiệm
Thông tin và các ấn phẩm này không nhằm mục đích, và không cấu thành, lời khuyên hoặc khuyến nghị về tài chính, đầu tư, giao dịch hay các loại khác do TradingView cung cấp hoặc xác nhận. Đọc thêm tại Điều khoản Sử dụng.
Bài đăng liên quan
Thông báo miễn trừ trách nhiệm
Thông tin và các ấn phẩm này không nhằm mục đích, và không cấu thành, lời khuyên hoặc khuyến nghị về tài chính, đầu tư, giao dịch hay các loại khác do TradingView cung cấp hoặc xác nhận. Đọc thêm tại Điều khoản Sử dụng.