
1. The Macro Perspective: The Multi-Week Accumulation Base
I am taking a LONG bias on Aditya Infotech Limited (CPPLUS) on the daily (1D) timeframe.
When analyzing pure market structure on a newly listed market leader, sideways digestion is crucial for building the kinetic energy required for the next markup phase. Following its previous rally, CPPLUS entered a rigid, multi-week horizontal accumulation block. This structure successfully absorbed profit-taking and allowed institutional capital to quietly accumulate shares. Fundamentally, this technical momentum aligns perfectly with Aditya Infotech's dominant position as India's largest security surveillance and CCTV company, holding an approximate 35% market share. The company recently reported that Q3 FY26 revenue grew 31% YoY, driven by AI-enabled camera demand from housing societies, smart cities, retail, and government deployments. Furthermore, the market is highly focused on the company's scheduled board meeting on May 27, 2026, to consider Audited Results and a Final Dividend.
2. The Educational Setup: Horizontal Boundary Defense
To understand the absolute technical validity behind this launch, look closely at how the price structure interacted with its core boundaries right before breaking out:
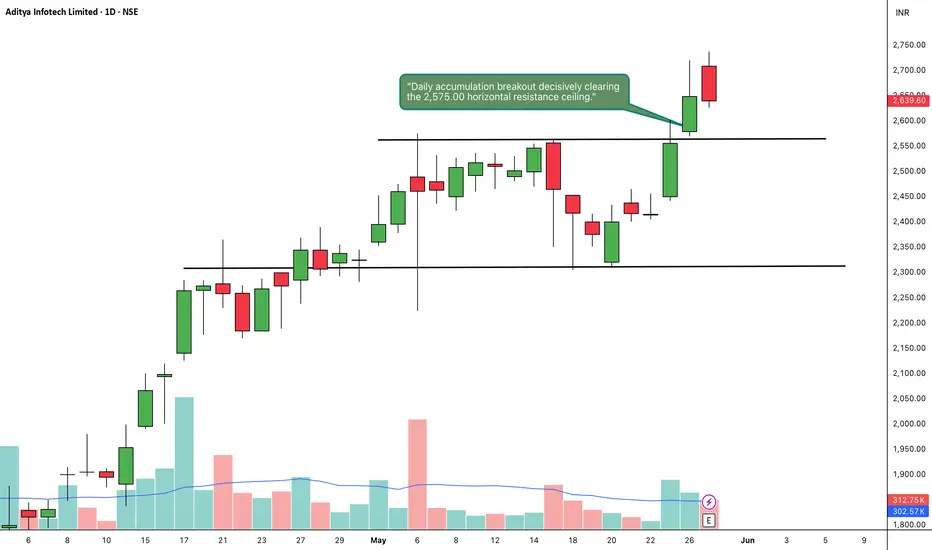
The 2,575.00 Resistance Ceiling: The definitive line in the sand for a bullish continuation was the solid black horizontal resistance line drawn near 2,575.00. As the price tested this line repeatedly, it established a heavy supply zone that systematically rejected upward expansion.
The 2,300.00 Structural Floor: During the consolidation block, sellers repeatedly tried to push the price lower but were aggressively halted at the 2,300.00 support line. This created a robust accumulation floor where institutional buyers stepped in, eventually allowing the daily moving averages to catch up and act as a dynamic launchpad.
3. Current Price Action: Breakout and Volatility Expansion
Look at the most recent daily candles on the far right of the chart. The structural pressure cooker has officially exploded. Buyers stepped in with undeniable conviction, printing a massive, full-bodied green expansion candle that decisively obliterated the 2,575.00 ceiling on a massive volume surge. Although the most recent daily candle printed a minor red inside day closing at 2,639.60, the stock has officially transitioned out of low-volatility accumulation and into a highly explosive markup trend into blue-sky territory.
4. The Trade Plan: Entries, Targets, and Risk Management
Entry Strategy: Momentum is exceptionally strong with the stock trading out in the open above the breakout line. The optimal, lowest-risk entry strategy involves letting the initial vertical excitement settle. Look to scale into long positions or place limit orders to catch a potential structural pullback that perfectly retests the broken 2,550.00 to 2,600.00 prior resistance zone. Letting old historical resistance prove itself as a concrete new support floor provides an unmatched risk-to-reward ratio.
Take Profit (Targets): We use a classical measured move strategy based on the depth of the accumulation base. By taking the absolute depth of the horizontal range (roughly 275 points from the 2,300.00 floor up to the 2,575.00 ceiling) and projecting it upward from the breakout point, our primary structural target sits comfortably in the 2,850.00 to 2,900.00 zone over the coming weeks, while broader analyst consensus currently points to a longer-term medium target of 3,200.00.
Invalidation (Stop Loss): An explosive breakout thesis is completely invalidated if the price fails to hold its newly claimed structural floor and collapses back inside the core of the base boundaries. A hard stop loss should be placed safely below the daily 20 SMA cushion and the mid-level of the base, specifically around the 2,400.00 to 2,450.00 level. A definitive daily close completely back below 2,400.00 would act as a severe warning sign of a failed breakout and a major bull trap.
5. Time Horizon:
Because this technical setup is built on a 1-Day chart capturing a clear structural phase transition and an all-time high horizontal breakout, this is a high-alpha swing trade designed to capture a rapid momentum markup phase over the coming weeks. Let the trend run!

Thông báo miễn trừ trách nhiệm
Thông tin và các ấn phẩm này không nhằm mục đích, và không cấu thành, lời khuyên hoặc khuyến nghị về tài chính, đầu tư, giao dịch hay các loại khác do TradingView cung cấp hoặc xác nhận. Đọc thêm tại Điều khoản Sử dụng.
Thông báo miễn trừ trách nhiệm
Thông tin và các ấn phẩm này không nhằm mục đích, và không cấu thành, lời khuyên hoặc khuyến nghị về tài chính, đầu tư, giao dịch hay các loại khác do TradingView cung cấp hoặc xác nhận. Đọc thêm tại Điều khoản Sử dụng.