
CROMPTON: Textbook Trend Reversal and Explosive Bottom Breakout
1. The Macro Perspective: The Deep Washout and Trend Shift
I am taking a LONG bias on Crompton Greaves Consumer Electricals Ltd. (CROMPTON) on the daily (1D) timeframe.
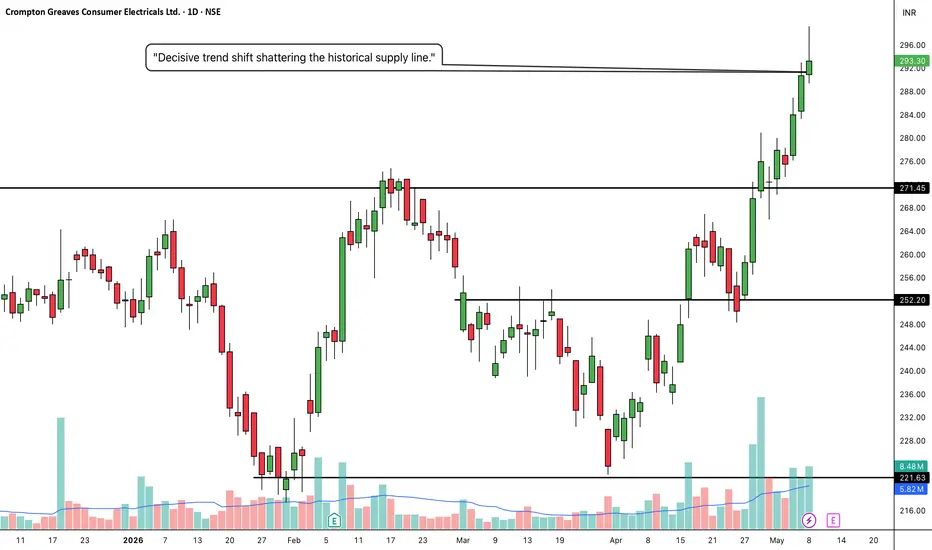
When analyzing pure market structure, identifying the exact moment a stock transitions from a bear market to a bull market offers the highest risk-to-reward setups possible. Looking at the left side of this chart, the stock suffered a brutal, highly volatile markdown phase. However, capitulation eventually set in. The stock established an absolute concrete floor down near the 221.63 level. Instead of continuing to bleed, it initiated a methodical, multi-month process of bottom accumulation, allowing heavy institutional capital to quietly absorb shares at a massive discount.
2. The Educational Setup: Building the Launchpad
To understand the sheer strength of this current breakout, look at how the price systematically built a reversal structure on the right side of the curve:
The Higher Lows: The most important rule of a trend reversal is the cessation of lower lows. After establishing the 221.63 floor, buyers aggressively stepped in at the 252.20 level, establishing a massive structural higher low and proving a shift in institutional intent.
The Accumulation Ceiling: For months, the stock was capped by the heavy solid black resistance line at 271.45. By forming a higher low and compressing tightly up against this neckline, the stock acted like a pressure cooker, transferring shares from impatient retail bag-holders to strong-handed buyers.
3. Current Price Action: The Reversal Confirmed
Look at the most recent daily candles on the far right. The pressure cooker has exploded. Buyers have effortlessly shattered the 271.45 resistance ceiling, printing powerful, consecutive green expansion candles and surging into the 290s. By decisively clearing this accumulation zone, CROMPTON has officially confirmed a macro trend reversal. The markdown phase is over; the markup phase has begun.
4. The Trade Plan: Entries, Targets, and Risk Management
Entry Strategy: Momentum is exceptionally strong right now near 293.30. Chasing a massive daily expansion always carries a higher risk of an immediate intraday pullback. The highest-probability, lowest-risk entry involves placing limit orders to catch a potential minor structural retest of the 271.00 to 275.00 breakout zone. Letting that old heavy resistance prove itself as a new, indestructible support floor offers a phenomenal risk-to-reward ratio.
Take Profit (Targets): Because the stock is systematically working its way back up the historical chart, our primary structural target is the massive red macro resistance line sitting clearly at 315.70. If momentum carries through that zone, the ultimate historical gap fill and secondary target sits in the 340.00 to 350.00 region.
Invalidation (Stop Loss): A trade thesis is only valid if the new market structure holds. A hard stop loss should be placed safely below the breakout line and the recent dashed mid-line pivot, around the 260.00 to 264.00 level. A definitive daily close completely back inside the old accumulation box and below the 252.20 structural floor would completely invalidate the reversal thesis.
5. Time Horizon:
Because this technical setup is built on a 1-Day chart capturing a massive structural phase transition and bottom breakout, this is a medium-term swing trade designed to capture the new markup phase. Let the new trend run!
I am taking a LONG bias on Crompton Greaves Consumer Electricals Ltd. (CROMPTON) on the daily (1D) timeframe.
When analyzing pure market structure, identifying the exact moment a stock transitions from a bear market to a bull market offers the highest risk-to-reward setups possible. Looking at the left side of this chart, the stock suffered a brutal, highly volatile markdown phase. However, capitulation eventually set in. The stock established an absolute concrete floor down near the 221.63 level. Instead of continuing to bleed, it initiated a methodical, multi-month process of bottom accumulation, allowing heavy institutional capital to quietly absorb shares at a massive discount.
2. The Educational Setup: Building the Launchpad
To understand the sheer strength of this current breakout, look at how the price systematically built a reversal structure on the right side of the curve:
The Higher Lows: The most important rule of a trend reversal is the cessation of lower lows. After establishing the 221.63 floor, buyers aggressively stepped in at the 252.20 level, establishing a massive structural higher low and proving a shift in institutional intent.
The Accumulation Ceiling: For months, the stock was capped by the heavy solid black resistance line at 271.45. By forming a higher low and compressing tightly up against this neckline, the stock acted like a pressure cooker, transferring shares from impatient retail bag-holders to strong-handed buyers.
3. Current Price Action: The Reversal Confirmed
Look at the most recent daily candles on the far right. The pressure cooker has exploded. Buyers have effortlessly shattered the 271.45 resistance ceiling, printing powerful, consecutive green expansion candles and surging into the 290s. By decisively clearing this accumulation zone, CROMPTON has officially confirmed a macro trend reversal. The markdown phase is over; the markup phase has begun.
4. The Trade Plan: Entries, Targets, and Risk Management
Entry Strategy: Momentum is exceptionally strong right now near 293.30. Chasing a massive daily expansion always carries a higher risk of an immediate intraday pullback. The highest-probability, lowest-risk entry involves placing limit orders to catch a potential minor structural retest of the 271.00 to 275.00 breakout zone. Letting that old heavy resistance prove itself as a new, indestructible support floor offers a phenomenal risk-to-reward ratio.
Take Profit (Targets): Because the stock is systematically working its way back up the historical chart, our primary structural target is the massive red macro resistance line sitting clearly at 315.70. If momentum carries through that zone, the ultimate historical gap fill and secondary target sits in the 340.00 to 350.00 region.
Invalidation (Stop Loss): A trade thesis is only valid if the new market structure holds. A hard stop loss should be placed safely below the breakout line and the recent dashed mid-line pivot, around the 260.00 to 264.00 level. A definitive daily close completely back inside the old accumulation box and below the 252.20 structural floor would completely invalidate the reversal thesis.
5. Time Horizon:
Because this technical setup is built on a 1-Day chart capturing a massive structural phase transition and bottom breakout, this is a medium-term swing trade designed to capture the new markup phase. Let the new trend run!
Đóng lệnh: dừng lỗ
Price crashed after fake breakout.
Thông báo miễn trừ trách nhiệm
Thông tin và các ấn phẩm này không nhằm mục đích, và không cấu thành, lời khuyên hoặc khuyến nghị về tài chính, đầu tư, giao dịch hay các loại khác do TradingView cung cấp hoặc xác nhận. Đọc thêm tại Điều khoản Sử dụng.
Thông báo miễn trừ trách nhiệm
Thông tin và các ấn phẩm này không nhằm mục đích, và không cấu thành, lời khuyên hoặc khuyến nghị về tài chính, đầu tư, giao dịch hay các loại khác do TradingView cung cấp hoặc xác nhận. Đọc thêm tại Điều khoản Sử dụng.