CS Group - CSGN
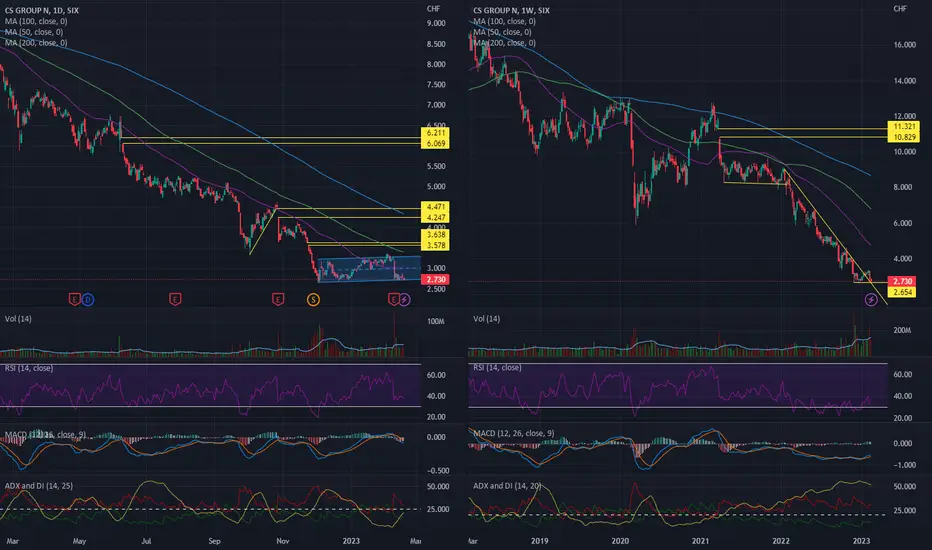
• Slightly upside corridor since beginning December 2022 (daily chart on the left side)
• The stock is currently trading at the bottom of the corridor (left side chart)
• Low volume in the last days (left side chart)
• Break out of the decreasing trend line in the last weeks (weekly chart on the right side)
• Supportline at 2.654 (right side chart)
• MACD line crossed the MACD Signal upward, which supports the outbreak of the decreasing trendline (right side chart)
• Stay neutral and wait if the support will hold
• The stock is currently trading at the bottom of the corridor (left side chart)
• Low volume in the last days (left side chart)
• Break out of the decreasing trend line in the last weeks (weekly chart on the right side)
• Supportline at 2.654 (right side chart)
• MACD line crossed the MACD Signal upward, which supports the outbreak of the decreasing trendline (right side chart)
• Stay neutral and wait if the support will hold

Thông báo miễn trừ trách nhiệm
Thông tin và các ấn phẩm này không nhằm mục đích, và không cấu thành, lời khuyên hoặc khuyến nghị về tài chính, đầu tư, giao dịch hay các loại khác do TradingView cung cấp hoặc xác nhận. Đọc thêm tại Điều khoản Sử dụng.
Thông báo miễn trừ trách nhiệm
Thông tin và các ấn phẩm này không nhằm mục đích, và không cấu thành, lời khuyên hoặc khuyến nghị về tài chính, đầu tư, giao dịch hay các loại khác do TradingView cung cấp hoặc xác nhận. Đọc thêm tại Điều khoản Sử dụng.