
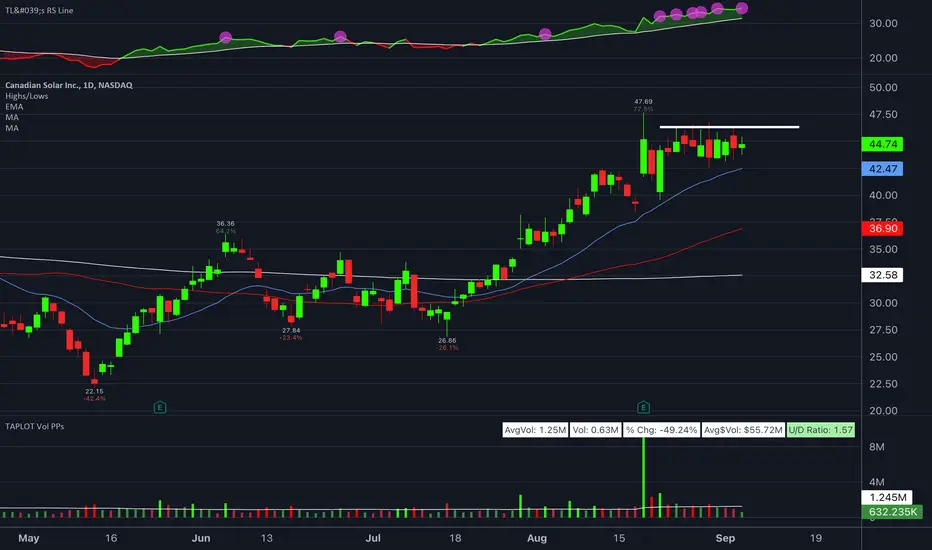
CSIQ is a market leader in today’s #1 sector - solar energy.
Shares soared over 60% between July and August as solar stocks came front and center as a leading theme in the market recovery. The 200-day moving average has begun sloping upward, putting CSIQ at the beginning of a new Stage 2 uptrend (see my previous post on the 4 Stages of the Stock Cycle).
The pink dots on the relative strength line on top of the chart signal new RS highs being made by CSIQ. In other words, the stock has held up better than the general market over the last couple weeks.
I’d like to see Tuesday’s action stay inside of Friday’s range to post a true inside day. If that happens, I will look to buy on a breakout above the Friday candle at 46.25.
Shares soared over 60% between July and August as solar stocks came front and center as a leading theme in the market recovery. The 200-day moving average has begun sloping upward, putting CSIQ at the beginning of a new Stage 2 uptrend (see my previous post on the 4 Stages of the Stock Cycle).
The pink dots on the relative strength line on top of the chart signal new RS highs being made by CSIQ. In other words, the stock has held up better than the general market over the last couple weeks.
I’d like to see Tuesday’s action stay inside of Friday’s range to post a true inside day. If that happens, I will look to buy on a breakout above the Friday candle at 46.25.

Bài đăng liên quan
Thông báo miễn trừ trách nhiệm
Thông tin và các ấn phẩm này không nhằm mục đích, và không cấu thành, lời khuyên hoặc khuyến nghị về tài chính, đầu tư, giao dịch hay các loại khác do TradingView cung cấp hoặc xác nhận. Đọc thêm tại Điều khoản Sử dụng.
Bài đăng liên quan
Thông báo miễn trừ trách nhiệm
Thông tin và các ấn phẩm này không nhằm mục đích, và không cấu thành, lời khuyên hoặc khuyến nghị về tài chính, đầu tư, giao dịch hay các loại khác do TradingView cung cấp hoặc xác nhận. Đọc thêm tại Điều khoản Sử dụng.