
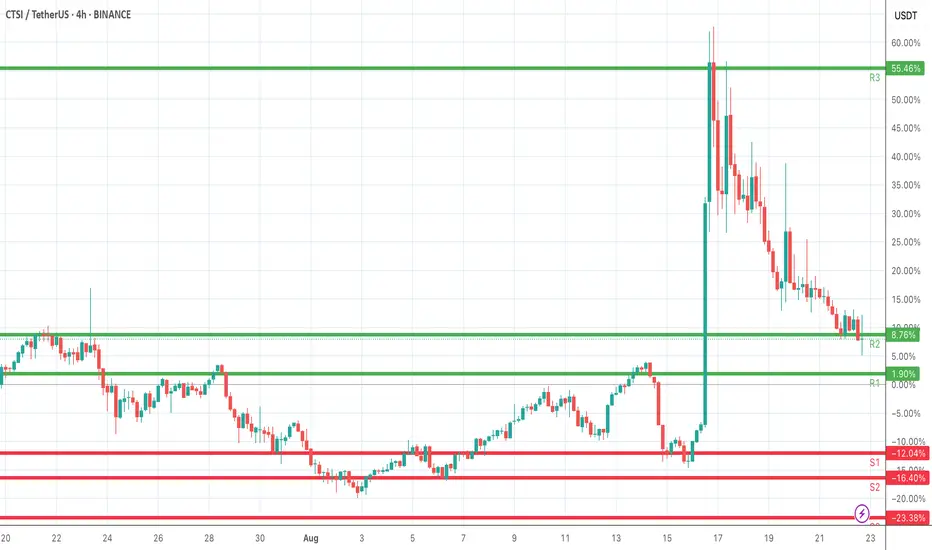
CTSI/USDT 4H chart
Levels:
• Resistance (R3): ~55.46%
• Resistance (R2): ~8.76%
• Resistance (R1): ~1.90%
• Support (S1): ~-12.04%
• Support (S2): ~-16.40%
• Support Zone: extends toward ~-23.38%
What the chart shows:
1. Price pumped hard to R3 (55.46%) but got rejected strongly.
2. Now it’s consolidating near R2 (8.76%), struggling to hold above it.
3. If it loses momentum, it may retest R1 (1.90%) or even dip into the support zone (S1–S2).
4. For a bullish move again, price must break and hold above R2 → R3, which seems like a tough resistance zone.
Trading perspective:
• Bullish case: If CTSI bounces above R2 and sustains, it could attempt another leg up.
• Bearish case: If it fails to hold R2, we might see a drop toward S1/S2.
At the moment, momentum looks weakened (lots of red candles after the big pump), so it may consolidate or retest support before any big move.
Levels:
• Resistance (R3): ~55.46%
• Resistance (R2): ~8.76%
• Resistance (R1): ~1.90%
• Support (S1): ~-12.04%
• Support (S2): ~-16.40%
• Support Zone: extends toward ~-23.38%
What the chart shows:
1. Price pumped hard to R3 (55.46%) but got rejected strongly.
2. Now it’s consolidating near R2 (8.76%), struggling to hold above it.
3. If it loses momentum, it may retest R1 (1.90%) or even dip into the support zone (S1–S2).
4. For a bullish move again, price must break and hold above R2 → R3, which seems like a tough resistance zone.
Trading perspective:
• Bullish case: If CTSI bounces above R2 and sustains, it could attempt another leg up.
• Bearish case: If it fails to hold R2, we might see a drop toward S1/S2.
At the moment, momentum looks weakened (lots of red candles after the big pump), so it may consolidate or retest support before any big move.

Thông báo miễn trừ trách nhiệm
Thông tin và các ấn phẩm này không nhằm mục đích, và không cấu thành, lời khuyên hoặc khuyến nghị về tài chính, đầu tư, giao dịch hay các loại khác do TradingView cung cấp hoặc xác nhận. Đọc thêm tại Điều khoản Sử dụng.
Thông báo miễn trừ trách nhiệm
Thông tin và các ấn phẩm này không nhằm mục đích, và không cấu thành, lời khuyên hoặc khuyến nghị về tài chính, đầu tư, giao dịch hay các loại khác do TradingView cung cấp hoặc xác nhận. Đọc thêm tại Điều khoản Sử dụng.