
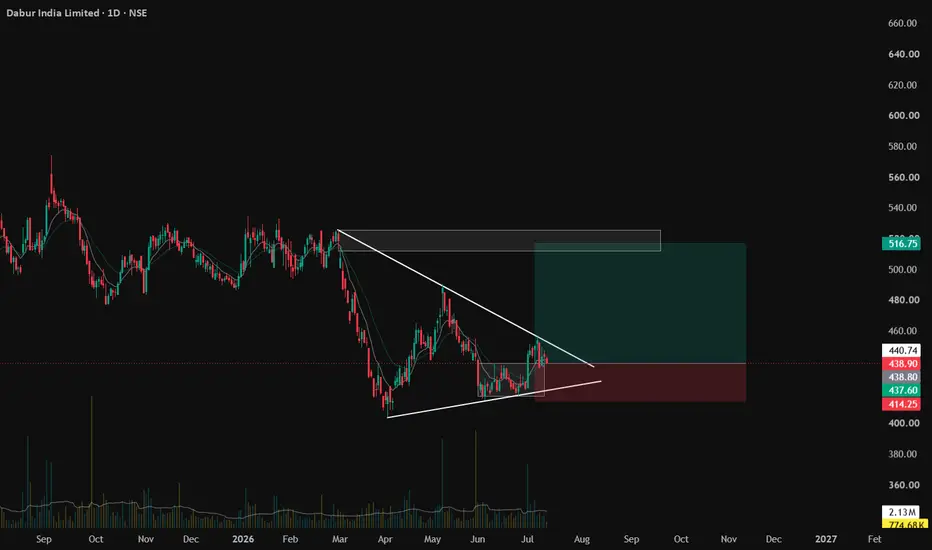
DABUR — Coiling Inside a Contracting Triangle, Testing Apex Resistance
Dabur India (NSE) has been in a broader downtrend since late 2025, falling from highs near ₹560 to a low around ₹414 by April 2026. Since then, price has been consolidating in a contracting/symmetrical triangle — lower highs capped by a descending trendline, and higher lows supported by an ascending trendline — a classic volatility-squeeze pattern.
Key observations:
Price is currently trading at ₹438.90, right at the apex of the triangle, testing the descending trendline resistance.
Immediate resistance/pivot zone sits around ₹440–443.
A larger supply zone lies overhead in the ₹500–516 region — the origin of the prior decline.
Support/demand zone below is marked around ₹414–438, coinciding with the recent swing lows and the triangle's lower boundary.
Bias:
A decisive close above the descending trendline (~₹440–443) with volume expansion could open room toward the ₹460–480 zone, with the ₹500–516 supply area as the next major hurdle. Conversely, failure to hold the rising trendline/support zone (~₹414–420) would suggest continuation of the downtrend.
Triangle breakouts can be false, so waiting for a confirmed close (not just an intraday poke) beyond either boundary, ideally with above-average volume, is prudent.
Not investment advice — for educational/analysis purposes only. Please do your own research before trading.

Thông báo miễn trừ trách nhiệm
Thông tin và các ấn phẩm này không nhằm mục đích, và không cấu thành, lời khuyên hoặc khuyến nghị về tài chính, đầu tư, giao dịch hay các loại khác do TradingView cung cấp hoặc xác nhận. Đọc thêm tại Điều khoản Sử dụng.
Thông báo miễn trừ trách nhiệm
Thông tin và các ấn phẩm này không nhằm mục đích, và không cấu thành, lời khuyên hoặc khuyến nghị về tài chính, đầu tư, giao dịch hay các loại khác do TradingView cung cấp hoặc xác nhận. Đọc thêm tại Điều khoản Sử dụng.