Long
Long term health of DEFI in a critical moment - Triangle version
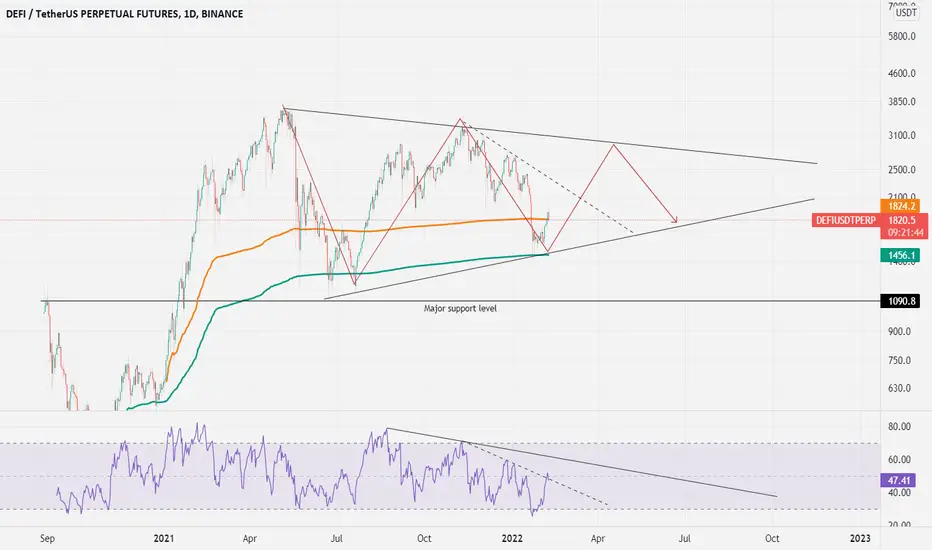
On my latest post, I mentioned that 1900 usdt was an important area to watch and which we were rejected.
On this set up, we can see that DEFI/USDT is forming a triangle on the LOG chart.
The RSI shows that we will enter in a long period of consolidation(look at the descending trend lines), however we will have some excellent gains if we play it well.
When we see this chart, we can be bullish on the defi coins until we touch the upper line of the triangle which we will exit positions & wait and see.
Follow for more updates.
On this set up, we can see that DEFI/USDT is forming a triangle on the LOG chart.
The RSI shows that we will enter in a long period of consolidation(look at the descending trend lines), however we will have some excellent gains if we play it well.
When we see this chart, we can be bullish on the defi coins until we touch the upper line of the triangle which we will exit positions & wait and see.
Follow for more updates.

Bài đăng liên quan
Thông báo miễn trừ trách nhiệm
Thông tin và các ấn phẩm này không nhằm mục đích, và không cấu thành, lời khuyên hoặc khuyến nghị về tài chính, đầu tư, giao dịch hay các loại khác do TradingView cung cấp hoặc xác nhận. Đọc thêm tại Điều khoản Sử dụng.
Bài đăng liên quan
Thông báo miễn trừ trách nhiệm
Thông tin và các ấn phẩm này không nhằm mục đích, và không cấu thành, lời khuyên hoặc khuyến nghị về tài chính, đầu tư, giao dịch hay các loại khác do TradingView cung cấp hoặc xác nhận. Đọc thêm tại Điều khoản Sử dụng.