Cập nhật
Inverse H&S Formation?
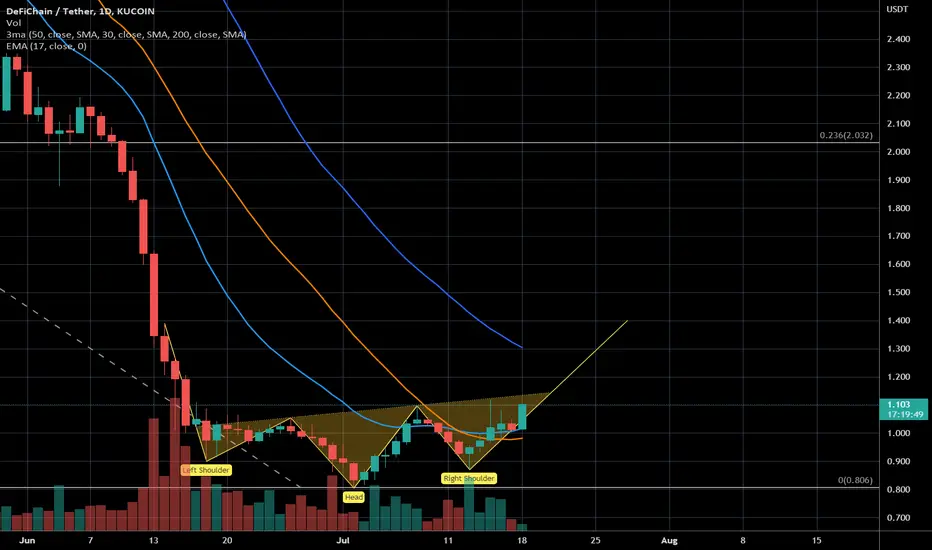
You can see an inverse H&S chart pattern is forming in DFI/USDT. We have broken the EMA 17 and SMA 30 already to the upside - the SMA 50 could offer a bit more resistance at currently 1.30 USD.
For me it seems like the crypto market could reverse (see also the BTC/USD chart) - not to approach the ATHs but to make a first move to the upside. We'll see.
For me it seems like the crypto market could reverse (see also the BTC/USD chart) - not to approach the ATHs but to make a first move to the upside. We'll see.
Ghi chú
It was going a bit longer sideways then I've expected - you may extend the right line further to the right. However - it seems that the formation has successfully broken to the upside.
Bài đăng liên quan
Thông báo miễn trừ trách nhiệm
Thông tin và các ấn phẩm này không nhằm mục đích, và không cấu thành, lời khuyên hoặc khuyến nghị về tài chính, đầu tư, giao dịch hay các loại khác do TradingView cung cấp hoặc xác nhận. Đọc thêm tại Điều khoản Sử dụng.
Bài đăng liên quan
Thông báo miễn trừ trách nhiệm
Thông tin và các ấn phẩm này không nhằm mục đích, và không cấu thành, lời khuyên hoặc khuyến nghị về tài chính, đầu tư, giao dịch hay các loại khác do TradingView cung cấp hoặc xác nhận. Đọc thêm tại Điều khoản Sử dụng.