
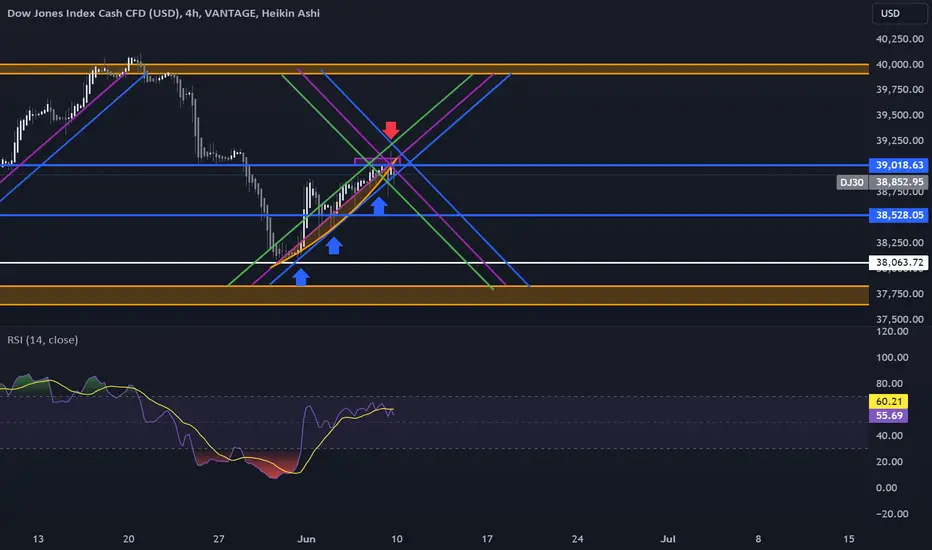
When you look at the daily range on DJ30 you can see that those zones ( horizontal blue) do not offer clean entries, because they are being honored.
But we get a clear direction and momentum and even though there is no clear RSI value, instead we have much volatility and a diagonal trendline being supported various times. The less distant it bounces from the trendline, the weaker it gets.
Pay attention to the new trendline that has been created. It might not be very accurate yet, because we have little data. But this is how it could possibly look like if this continues to drop...
But we get a clear direction and momentum and even though there is no clear RSI value, instead we have much volatility and a diagonal trendline being supported various times. The less distant it bounces from the trendline, the weaker it gets.
Pay attention to the new trendline that has been created. It might not be very accurate yet, because we have little data. But this is how it could possibly look like if this continues to drop...

Thông báo miễn trừ trách nhiệm
Thông tin và các ấn phẩm này không nhằm mục đích, và không cấu thành, lời khuyên hoặc khuyến nghị về tài chính, đầu tư, giao dịch hay các loại khác do TradingView cung cấp hoặc xác nhận. Đọc thêm tại Điều khoản Sử dụng.
Thông báo miễn trừ trách nhiệm
Thông tin và các ấn phẩm này không nhằm mục đích, và không cấu thành, lời khuyên hoặc khuyến nghị về tài chính, đầu tư, giao dịch hay các loại khác do TradingView cung cấp hoặc xác nhận. Đọc thêm tại Điều khoản Sử dụng.