
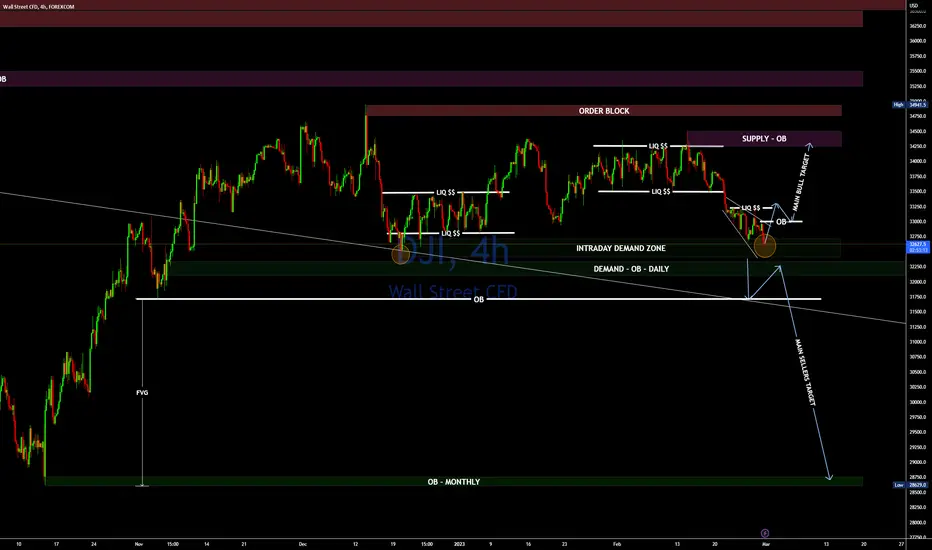
On a weekly chart, the price broke above the upper band of an expanding wedge channel, now it just made its second retest of the upper band- making that level a bit more stronger (provided it does not get broken).
So, i am having 2 bias, one is mid-term bullish bias as shown in the above chart. A break above the Intraday - OB followed by a retest would mean that buyers are still very much interested in riding the price back up.
Alternatively, if the price break down and fall back inside the wedge (weekly) then the FVG could get filled up and it's going to be a quick bearish down pour.
So, stay close and watch how it plays out.
So, i am having 2 bias, one is mid-term bullish bias as shown in the above chart. A break above the Intraday - OB followed by a retest would mean that buyers are still very much interested in riding the price back up.
Alternatively, if the price break down and fall back inside the wedge (weekly) then the FVG could get filled up and it's going to be a quick bearish down pour.
So, stay close and watch how it plays out.
Ghi chú
IF THE BREKOUT HAPPENED SUCCESSFULLY, THEN WAIT FOR THE RETEST AS SHOWN BELOW :THEN LOOK FOR BUY OPPORTUNITY 👇
Ghi chú
FOR AN AGGRESSIVE TRADERS, IT'S LOOKING LIKE CHRISTMAS, BUT FOR TRADERS ANTICIPATING FOR PULLBACK, IT'S STILL GOINIG TO COME.
Thông báo miễn trừ trách nhiệm
Thông tin và các ấn phẩm này không nhằm mục đích, và không cấu thành, lời khuyên hoặc khuyến nghị về tài chính, đầu tư, giao dịch hay các loại khác do TradingView cung cấp hoặc xác nhận. Đọc thêm tại Điều khoản Sử dụng.
Thông báo miễn trừ trách nhiệm
Thông tin và các ấn phẩm này không nhằm mục đích, và không cấu thành, lời khuyên hoặc khuyến nghị về tài chính, đầu tư, giao dịch hay các loại khác do TradingView cung cấp hoặc xác nhận. Đọc thêm tại Điều khoản Sử dụng.