Long
DOCK Long-Term Chart Fully Mapped + Analysis (+320%+)
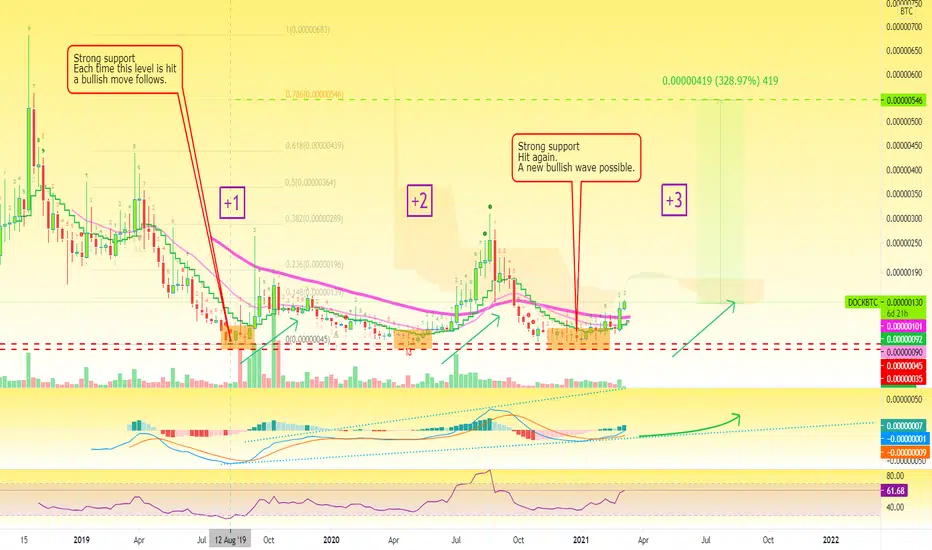
DOCKBTC has been doing good in the last two weeks... Hit LIKE and let's look at it.
First, we have a break and close (level conquered) of EMA10 and EMA50... Great news.
The MACD is super bullish:
The weekly RSI is above 60.
You can find additional details such as Fib. levels (targets) marked on the chart.
Thanks a lot for reading.
Namaste.
First, we have a break and close (level conquered) of EMA10 and EMA50... Great news.
The MACD is super bullish:
- 1- The histogram has gone green.
- 2- There is a bullish cross with prices trending higher.
- 3- Ever since August 2019, we have higher highs and higher lows.
The weekly RSI is above 60.
- On the weekly, 30+ is good while 40+ is already bullish/strong.
You can find additional details such as Fib. levels (targets) marked on the chart.
Thanks a lot for reading.
Namaste.

🔥 Get the FULL (4-in-1) PREMIUM PACKAGE 👇
t.me/lamatrades/4 (Since 2017)
✅ FREE PREMIUM trade-numbers (4-10X) 👇
t.me/masteranandatrades/9043
🚨 TOP Results May 2026 👇
t.me/masteranandatrades/8778
t.me/lamatrades/4 (Since 2017)
✅ FREE PREMIUM trade-numbers (4-10X) 👇
t.me/masteranandatrades/9043
🚨 TOP Results May 2026 👇
t.me/masteranandatrades/8778
Bài đăng liên quan
Thông báo miễn trừ trách nhiệm
Thông tin và các ấn phẩm này không nhằm mục đích, và không cấu thành, lời khuyên hoặc khuyến nghị về tài chính, đầu tư, giao dịch hay các loại khác do TradingView cung cấp hoặc xác nhận. Đọc thêm tại Điều khoản Sử dụng.
🔥 Get the FULL (4-in-1) PREMIUM PACKAGE 👇
t.me/lamatrades/4 (Since 2017)
✅ FREE PREMIUM trade-numbers (4-10X) 👇
t.me/masteranandatrades/9043
🚨 TOP Results May 2026 👇
t.me/masteranandatrades/8778
t.me/lamatrades/4 (Since 2017)
✅ FREE PREMIUM trade-numbers (4-10X) 👇
t.me/masteranandatrades/9043
🚨 TOP Results May 2026 👇
t.me/masteranandatrades/8778
Bài đăng liên quan
Thông báo miễn trừ trách nhiệm
Thông tin và các ấn phẩm này không nhằm mục đích, và không cấu thành, lời khuyên hoặc khuyến nghị về tài chính, đầu tư, giao dịch hay các loại khác do TradingView cung cấp hoặc xác nhận. Đọc thêm tại Điều khoản Sử dụng.