
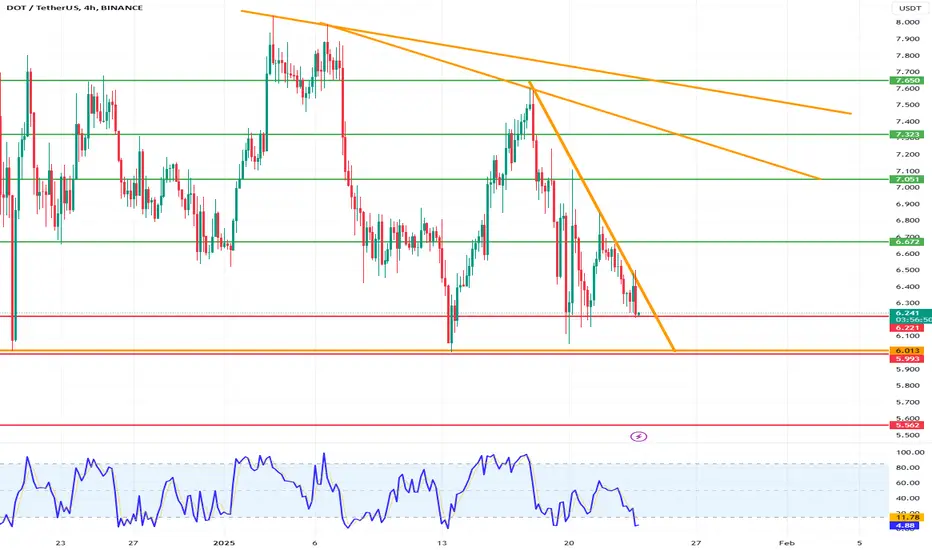
Hello everyone, let's look at the 4H DOT to USDT chart, in this situation we can see how the price is bouncing off the local downtrend line, only when it breaks out of it upwards will it be able to move towards the next two trend lines.
Let's start by defining the targets for the near future that the price has to face:
T1 = 6.67 USD
T2 = 7.05 USD
Т3 = 7.32 USD
Т4 = 7.65 USD
Now let's move on to the stop-loss in case the market continues to fall:
SL1 = 6.22 USD
SL2 = 5.99 USD
SL3 = 5.56 USD
Considering the STOCH indicator we can see how we are again going below the lower boundary, which could potentially indicate an upcoming attempt to change the price direction.
Let's start by defining the targets for the near future that the price has to face:
T1 = 6.67 USD
T2 = 7.05 USD
Т3 = 7.32 USD
Т4 = 7.65 USD
Now let's move on to the stop-loss in case the market continues to fall:
SL1 = 6.22 USD
SL2 = 5.99 USD
SL3 = 5.56 USD
Considering the STOCH indicator we can see how we are again going below the lower boundary, which could potentially indicate an upcoming attempt to change the price direction.

Thông báo miễn trừ trách nhiệm
Thông tin và các ấn phẩm này không nhằm mục đích, và không cấu thành, lời khuyên hoặc khuyến nghị về tài chính, đầu tư, giao dịch hay các loại khác do TradingView cung cấp hoặc xác nhận. Đọc thêm tại Điều khoản Sử dụng.
Thông báo miễn trừ trách nhiệm
Thông tin và các ấn phẩm này không nhằm mục đích, và không cấu thành, lời khuyên hoặc khuyến nghị về tài chính, đầu tư, giao dịch hay các loại khác do TradingView cung cấp hoặc xác nhận. Đọc thêm tại Điều khoản Sử dụng.