 DRREDDY
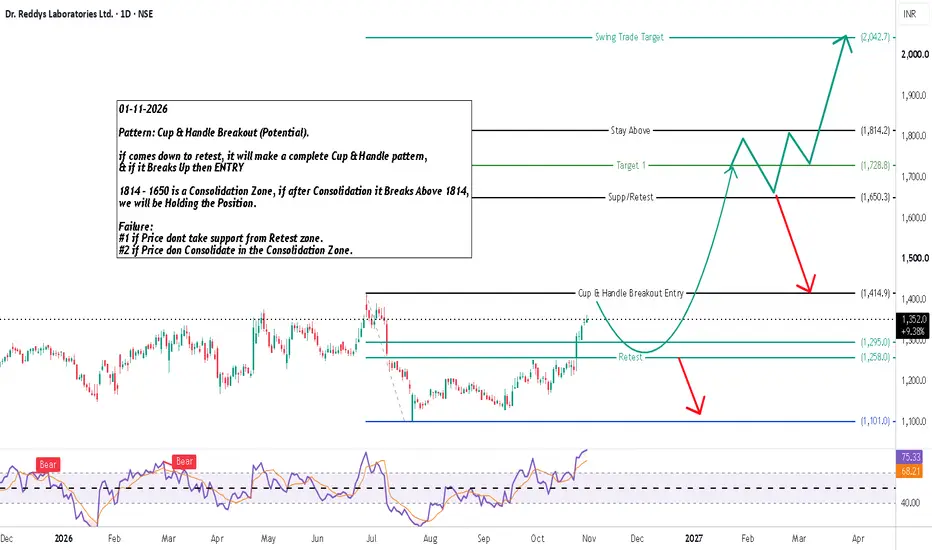
Dr. Reddy’s Laboratories Limited is forming a potential **Cup & Handle Breakout** continuation structure on the daily chart. The stock is recovering strongly from its base lows, trading at ₹1,352.00 (+0.52%). As noted in the chart plan: "if comes down to retest, it will make a complete Cup & Handle pattern, & if it Breaks Up then ENTRY. 1814 - 1650 is a Consolidation Zone, if after Consolidation it Breaks Above 1814, we will be Holding the Position."
🔹 PATTERN: CUP & HANDLE BREAKOUT (POTENTIAL)
• Pattern Structure: Rounded accumulation cup spanning from the breakdown high down to the major base floor at ₹1,101.00, developing a handle retest structure.
• Cup & Handle Breakout Entry: Major neckline resistance trigger located at ₹1,414.90.
• Retest / Support Zone: Immediate demand shelf spanning ₹1,258.00 – ₹1,295.00.
• Post-Breakout Support / Retest Pivot: Horizontal support level at ₹1,650.30.
• Consolidation Zone: Post-breakout target range between ₹1,650.00 and ₹1,814.20.
🟢 UPSIDE SCENARIO – BULLISH BREAKOUT & CONSOLIDATION
• Primary Breakout Entry (BUY Entry): ₹1,414.90 (Cup & Handle Breakout Entry)
• Confirmation Required: Daily candle close above ₹1,414.90
• TARGET 1: ₹1,728.80 (+22.19% move from ₹1,414.90 BUY entry)
• Stay Above Consolidation Boundary: ₹1,814.20 (+28.22% move from BUY entry)
• SWING TRADE TARGET: ₹2,042.70 (+44.39% move from BUY entry)
🔴 DOWNSIDE SCENARIO – BEARISH FAILURE
• Failure Conditions (Chart Rules): #1 if Price don't take support from Retest zone. #2 if Price don't Consolidate in the Consolidation Zone.
• Weakening Level: Rejection near ₹1,414.90 followed by a drop below ₹1,295.00
• Important Support Levels: ₹1,300.00, ₹1,295.00, ₹1,258.00 (Retest zone), and ₹1,101.00 (Base Low)
• Invalidation / Stop Loss (SL): Daily candle close below base low at ₹1,101.00 (-22.19% SL from ₹1,414.90 BUY entry) or tighter stop below retest support at ₹1,258.00 (-11.09% SL).
🔹 MY BREAKOUT & EXIT RULE
If price crosses above a key resistance level (such as ₹1,414.90, ₹1,728.80, or ₹1,814.20) and makes a High above that level, but closes below that same level, I consider it a failed breakout/rejection and the BUYER NEEDS TO EXIT THE TRADE.
High above level + Close below level = Failed breakout → EXIT BUY TRADE.
🎯 MY TRADE ROADMAP
Bullish Breakout Path:
Pullback / Retest toward ₹1,258.00 – ₹1,295.00 Retest Zone
↓
Completion of Cup & Handle Pattern & Rebound
↓
₹1,414.90 Cup & Handle Breakout Entry (BUY Entry)
↓
₹1,728.80 TARGET 1 (+22.19% from BUY Entry)
↓
₹1,650.30 – ₹1,814.20 Consolidation Zone (Hold Position Above ₹1,814.20)
↓
₹2,042.70 SWING TRADE TARGET (+44.39% from BUY Entry)
Bearish Breakdown Path:
Failure to hold ₹1,258.00 Retest Support (Failure Rule #1)
↓
Loss of intermediate demand shelves
↓
₹1,101.00 Major Base Low Invalidation (-22.19% SL from BUY Entry)
🔑 MY VIEW
The preferred setup is a structured Cup & Handle continuation, waiting for price to complete its retest phase before triggering a high-conviction breakout entry above ₹1,414.90. Holding support above the ₹1,258.00 – ₹1,295.00 retest floor is critical to validate the pattern structure.
The bullish expansion thesis activates upon a confirmed daily close above ₹1,414.90 (BUY Entry), driving price toward TARGET 1 at ₹1,728.80 (+22.19%), entering the ₹1,650.00 – ₹1,814.20 consolidation zone, and extending toward the Swing Trade Target at ₹2,042.70 (+44.39% from BUY Entry). The setup invalidates if price fails to take support from the retest zone or fails to consolidate correctly, breaching ₹1,101.00 (-22.19% SL). A valid breakout requires a solid daily candle close above trigger levels, strictly adhering to the candle-close exit rule if a rejection occurs.
---
This is technical analysis based on chart structure, price levels, and visual patterns shown above. It is not financial advice. Market conditions can change and actual price movement may differ from projected levels.

Thông báo miễn trừ trách nhiệm
Thông tin và các ấn phẩm này không nhằm mục đích, và không cấu thành, lời khuyên hoặc khuyến nghị về tài chính, đầu tư, giao dịch hay các loại khác do TradingView cung cấp hoặc xác nhận. Đọc thêm tại Điều khoản Sử dụng.
Thông báo miễn trừ trách nhiệm
Thông tin và các ấn phẩm này không nhằm mục đích, và không cấu thành, lời khuyên hoặc khuyến nghị về tài chính, đầu tư, giao dịch hay các loại khác do TradingView cung cấp hoặc xác nhận. Đọc thêm tại Điều khoản Sử dụng.