
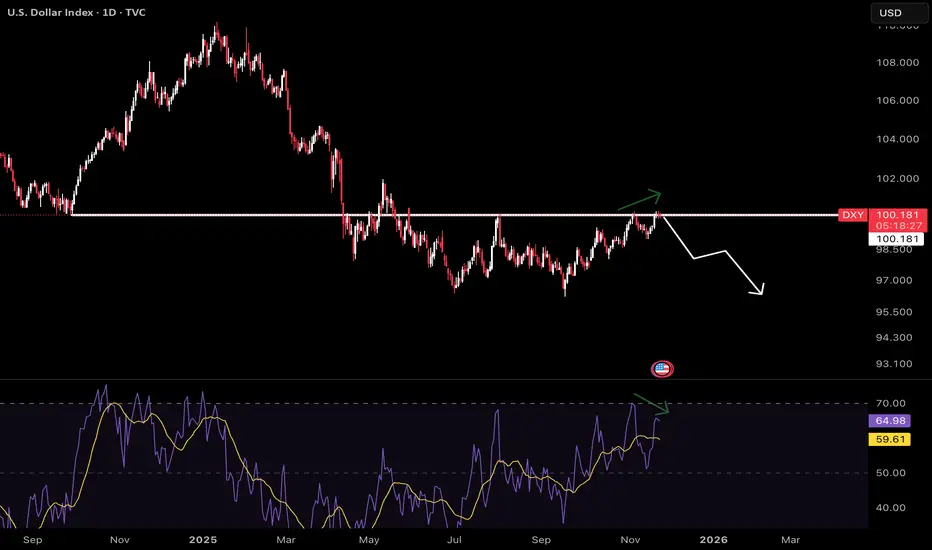
- This chart tracks the daily price of DXY , revealing key technical and macro dynamics relevant for traders and investors in risk-on markets.
- The DXY has approached a major horizontal resistance level near 100.2, a zone that previously acted as both support and resistance.
- While price tests this resistance, the RSI shows a classic bearish divergence, DXY has made higher highs on price, but RSI has failed to confirm new momentum highs. This gap signals underlying exhaustion, suggesting that further upside for the dollar may be limited in the near term.
- A falling DXY signals easier liquidity and can catalyze rallies in riskier asset classes. Traders often watch DXY movements for clues on when to deploy capital into stocks or crypto.
Giao dịch đang hoạt động
DXY rejected the resistance zone presented earlier. This confirms:
Bearish divergence is playing out as expected
Sellers stepped in at the key resistance level
Lower highs forming on price while RSI shows lower highs = confirmed downtrend
Next support zone now becomes key. Watch for reversal or breakdown confirmation
Risk assets (BTC, altcoins) likely to benefit from weakening dollar structure

Thông báo miễn trừ trách nhiệm
Thông tin và các ấn phẩm này không nhằm mục đích, và không cấu thành, lời khuyên hoặc khuyến nghị về tài chính, đầu tư, giao dịch hay các loại khác do TradingView cung cấp hoặc xác nhận. Đọc thêm tại Điều khoản Sử dụng.
Thông báo miễn trừ trách nhiệm
Thông tin và các ấn phẩm này không nhằm mục đích, và không cấu thành, lời khuyên hoặc khuyến nghị về tài chính, đầu tư, giao dịch hay các loại khác do TradingView cung cấp hoặc xác nhận. Đọc thêm tại Điều khoản Sử dụng.