
**Monthly Chart**
DXY monthly candle closed as bullish. This month's candle (still active) reached the supply zone last week around the 106 level and bounced lower from it.
Note: I don’t trade DXY but I use it as an indication when analyzing other currency pairs linked to USD.
**Weekly Chart**
Last week's candle closed as a bearish engulfing suggesting a reverse trend lower at least to test the demand zone around the 104 level and then moving lower to the 103 level.
**Daily Chart**
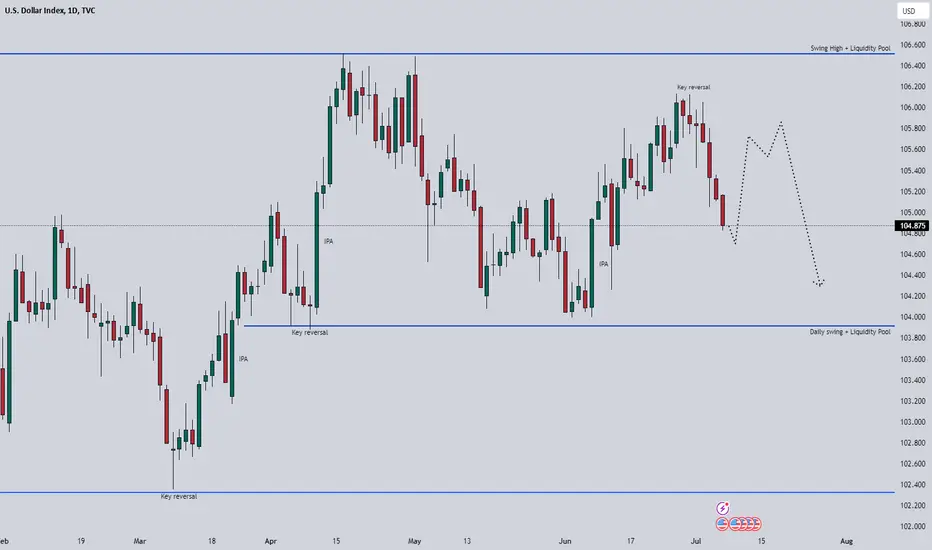
This week, DXY is expected to have a corrective wave structure and consolidate before continuing the downward movement. There will be a release of monthly and yearly CPI on Thursday which can provide some strength to USD.
DXY monthly candle closed as bullish. This month's candle (still active) reached the supply zone last week around the 106 level and bounced lower from it.
Note: I don’t trade DXY but I use it as an indication when analyzing other currency pairs linked to USD.
**Weekly Chart**
Last week's candle closed as a bearish engulfing suggesting a reverse trend lower at least to test the demand zone around the 104 level and then moving lower to the 103 level.
**Daily Chart**
This week, DXY is expected to have a corrective wave structure and consolidate before continuing the downward movement. There will be a release of monthly and yearly CPI on Thursday which can provide some strength to USD.
Ghi chú
DXY was moving in a consolidation range last week. However, the bias is still to the downside. This week I am expecting to see a move lower at least below 104.00 level and then will be targeting 103.50 and 102.50 levels in the upcoming weeks.Đóng lệnh: đạt mục tiêu
DXY moved as predicted. Target reached.
Helping traders pass funding challenges and become consistently profitable 💰 with a simple, structured trading system.
I offer Private Trader Mentorship Program. This is Exclusive program by Invitation Only. Contact me directly for more information.
I offer Private Trader Mentorship Program. This is Exclusive program by Invitation Only. Contact me directly for more information.
Bài đăng liên quan
Thông báo miễn trừ trách nhiệm
Thông tin và các ấn phẩm này không nhằm mục đích, và không cấu thành, lời khuyên hoặc khuyến nghị về tài chính, đầu tư, giao dịch hay các loại khác do TradingView cung cấp hoặc xác nhận. Đọc thêm tại Điều khoản Sử dụng.
Helping traders pass funding challenges and become consistently profitable 💰 with a simple, structured trading system.
I offer Private Trader Mentorship Program. This is Exclusive program by Invitation Only. Contact me directly for more information.
I offer Private Trader Mentorship Program. This is Exclusive program by Invitation Only. Contact me directly for more information.
Bài đăng liên quan
Thông báo miễn trừ trách nhiệm
Thông tin và các ấn phẩm này không nhằm mục đích, và không cấu thành, lời khuyên hoặc khuyến nghị về tài chính, đầu tư, giao dịch hay các loại khác do TradingView cung cấp hoặc xác nhận. Đọc thêm tại Điều khoản Sử dụng.