
hello
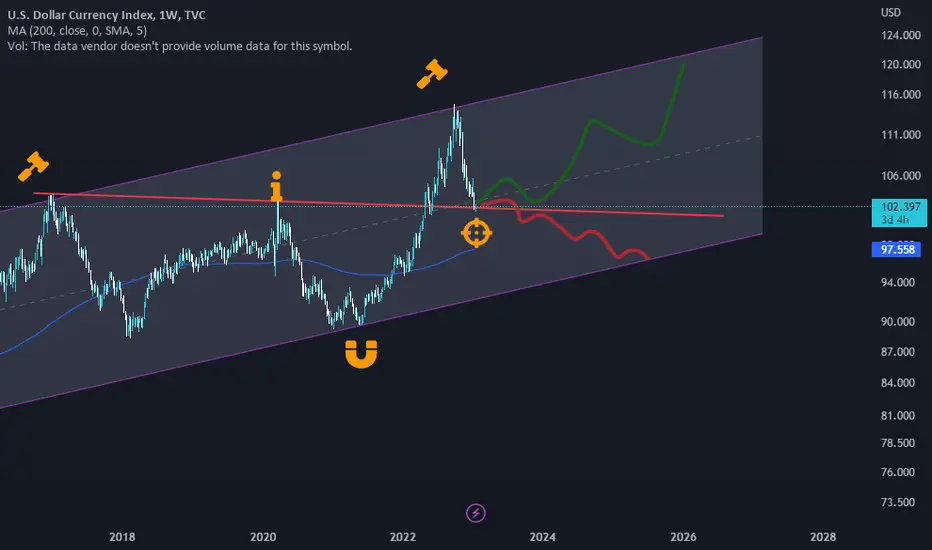
my analyze on DXY chart is a bullish channel
price hit top of channel and then goes down, 1 week ago hitted an Support(Was Resistance before) and react to it, now i can goes top again or break it and then goes to bottom of channel.
also here it is 0.618 Fibo from last bullish wave but price have bearish momentum ,
lets see what will happen and waiting for confirmations.
Hope you enjoy this analyze and like it,
comment your idea about DXY.
Follow for more analyze.
my analyze on DXY chart is a bullish channel
price hit top of channel and then goes down, 1 week ago hitted an Support(Was Resistance before) and react to it, now i can goes top again or break it and then goes to bottom of channel.
also here it is 0.618 Fibo from last bullish wave but price have bearish momentum ,
lets see what will happen and waiting for confirmations.
Hope you enjoy this analyze and like it,
comment your idea about DXY.
Follow for more analyze.

Thông báo miễn trừ trách nhiệm
Thông tin và các ấn phẩm này không nhằm mục đích, và không cấu thành, lời khuyên hoặc khuyến nghị về tài chính, đầu tư, giao dịch hay các loại khác do TradingView cung cấp hoặc xác nhận. Đọc thêm tại Điều khoản Sử dụng.
Thông báo miễn trừ trách nhiệm
Thông tin và các ấn phẩm này không nhằm mục đích, và không cấu thành, lời khuyên hoặc khuyến nghị về tài chính, đầu tư, giao dịch hay các loại khác do TradingView cung cấp hoặc xác nhận. Đọc thêm tại Điều khoản Sử dụng.