
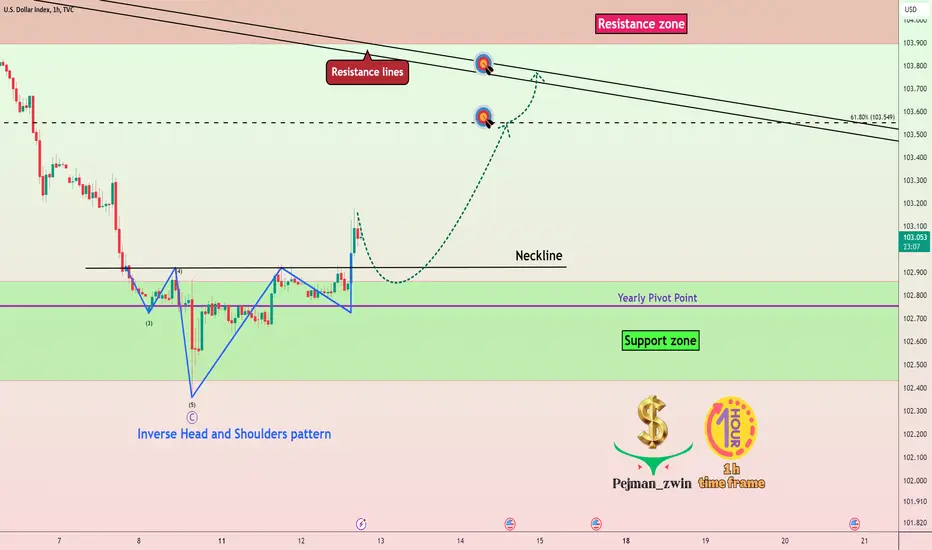
🏃♂️The DXY Index is moving in the 🟢Support zone($102.87-$102.43)🟢.
📈 Regarding Classical Technical Analysis, the dollar index has successfully formed an Inverse Head and Shoulders pattern.
🌊According to the theory of Elliott waves, the dollar index has completed a Zigzag correction(ABC/5-3-5) in the 🟢Support zone($102.87-$102.43)🟢.
🔔I expect the DXY Index to rise to at least the 61.8% Fibonacci level and Resistance lines.
U.S.Dollar Currency Index ( DXYUSD ) Analyze, 1-hour time frame⏰.
Do not forget to put Stop loss for your positions (For every position you want to open).
Please follow your strategy; this is just my Idea, and I will gladly see your ideas in this post.
Please do not forget the ✅' like'✅ button 🙏😊 & Share it with your friends; thanks, and Trade safe.
📈 Regarding Classical Technical Analysis, the dollar index has successfully formed an Inverse Head and Shoulders pattern.
🌊According to the theory of Elliott waves, the dollar index has completed a Zigzag correction(ABC/5-3-5) in the 🟢Support zone($102.87-$102.43)🟢.
🔔I expect the DXY Index to rise to at least the 61.8% Fibonacci level and Resistance lines.
U.S.Dollar Currency Index ( DXYUSD ) Analyze, 1-hour time frame⏰.
Do not forget to put Stop loss for your positions (For every position you want to open).
Please follow your strategy; this is just my Idea, and I will gladly see your ideas in this post.
Please do not forget the ✅' like'✅ button 🙏😊 & Share it with your friends; thanks, and Trade safe.
Giao dịch đang hoạt động
Ghi chú
✅Running well✅Đóng lệnh: đạt mục tiêu

ProTrader365 | Crypto & Forex Analyst
8+ Years Experience • Elliott Wave • Volume & Order Flow
Free Signals, Market Analysis & Education
Explore our community & VIP services:
linktr.ee/ProTrader365
8+ Years Experience • Elliott Wave • Volume & Order Flow
Free Signals, Market Analysis & Education
Explore our community & VIP services:
linktr.ee/ProTrader365
Bài đăng liên quan
Thông báo miễn trừ trách nhiệm
Thông tin và các ấn phẩm này không nhằm mục đích, và không cấu thành, lời khuyên hoặc khuyến nghị về tài chính, đầu tư, giao dịch hay các loại khác do TradingView cung cấp hoặc xác nhận. Đọc thêm tại Điều khoản Sử dụng.
ProTrader365 | Crypto & Forex Analyst
8+ Years Experience • Elliott Wave • Volume & Order Flow
Free Signals, Market Analysis & Education
Explore our community & VIP services:
linktr.ee/ProTrader365
8+ Years Experience • Elliott Wave • Volume & Order Flow
Free Signals, Market Analysis & Education
Explore our community & VIP services:
linktr.ee/ProTrader365
Bài đăng liên quan
Thông báo miễn trừ trách nhiệm
Thông tin và các ấn phẩm này không nhằm mục đích, và không cấu thành, lời khuyên hoặc khuyến nghị về tài chính, đầu tư, giao dịch hay các loại khác do TradingView cung cấp hoặc xác nhận. Đọc thêm tại Điều khoản Sử dụng.