
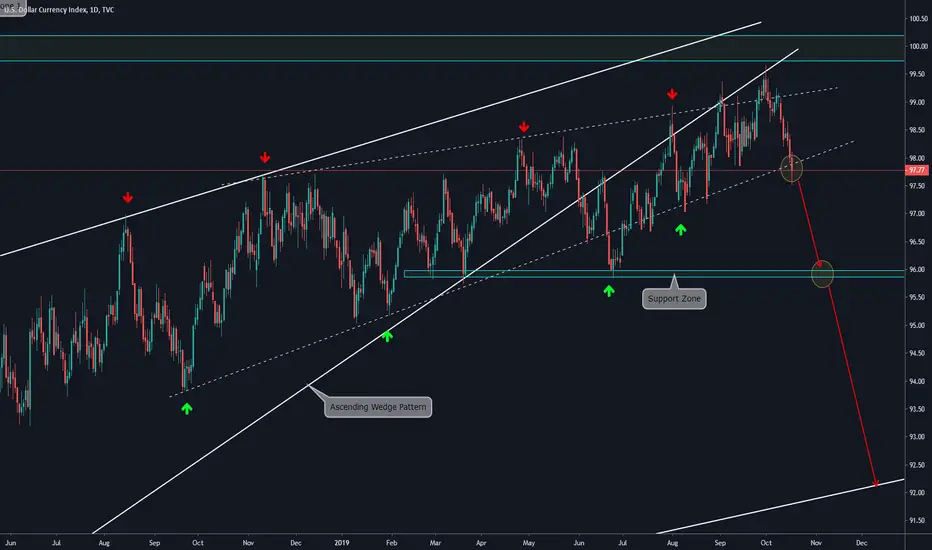
DAILY CHART EXPLANATION:
On this timeframe, we observe that the Dollar Index has been on a bullish movement since March '18. However, the last year, the bullish momentum started getting weaker forming a secondary wedge pattern below the Broken Main Wedge. It has bounced at the Top of the Wedge Pattern and at this moment price is breaking down the pattern. If it manages to consolidate below, the movement will be almost confirmed. We will look for a corrective structure on a lower timeframe to take short positions. The main target is the Support Zone at 96.00, and, if this zone is broken, then the Weekly Ascending Trendline will be the potential target area.
On this timeframe, we observe that the Dollar Index has been on a bullish movement since March '18. However, the last year, the bullish momentum started getting weaker forming a secondary wedge pattern below the Broken Main Wedge. It has bounced at the Top of the Wedge Pattern and at this moment price is breaking down the pattern. If it manages to consolidate below, the movement will be almost confirmed. We will look for a corrective structure on a lower timeframe to take short positions. The main target is the Support Zone at 96.00, and, if this zone is broken, then the Weekly Ascending Trendline will be the potential target area.

Bài đăng liên quan
Thông báo miễn trừ trách nhiệm
Thông tin và các ấn phẩm này không nhằm mục đích, và không cấu thành, lời khuyên hoặc khuyến nghị về tài chính, đầu tư, giao dịch hay các loại khác do TradingView cung cấp hoặc xác nhận. Đọc thêm tại Điều khoản Sử dụng.
Bài đăng liên quan
Thông báo miễn trừ trách nhiệm
Thông tin và các ấn phẩm này không nhằm mục đích, và không cấu thành, lời khuyên hoặc khuyến nghị về tài chính, đầu tư, giao dịch hay các loại khác do TradingView cung cấp hoặc xác nhận. Đọc thêm tại Điều khoản Sử dụng.