
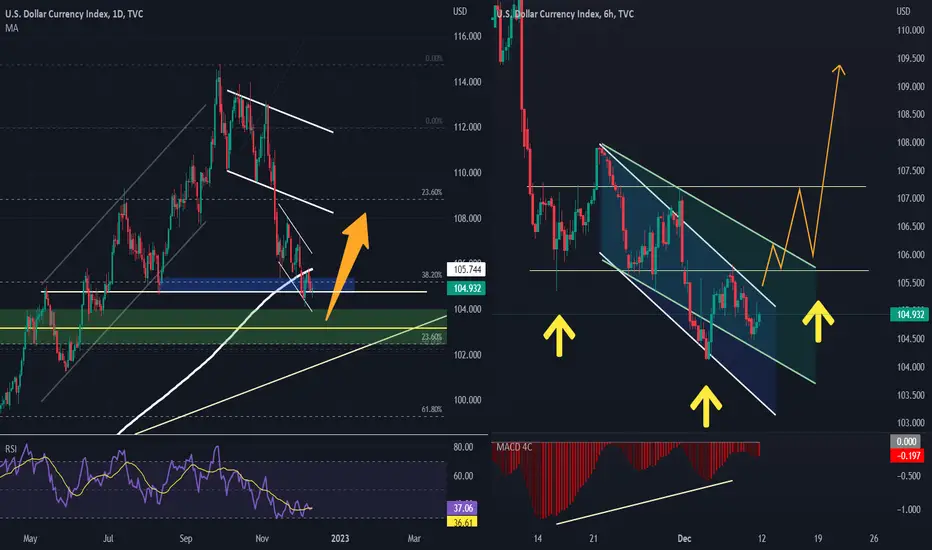
On the daily chart, The DXY holds in a powerful resistance zone; there is a 200DMA, monthly resistance, weekly resistance, and a supply zone with a 38.20 Fib.
In the 6-hour time frame, we have two reversal patterns, with a divergence in the MACD.
We may see a head and shoulders pattern if a candle closes above 105.74, as shown by the yellow arrows on the hourly chart.
--------------------------------
Feel free to share your thoughts in the comments, and kindly support the idea with a like. Your support is greatly appreciated!
In the 6-hour time frame, we have two reversal patterns, with a divergence in the MACD.
We may see a head and shoulders pattern if a candle closes above 105.74, as shown by the yellow arrows on the hourly chart.
--------------------------------
Feel free to share your thoughts in the comments, and kindly support the idea with a like. Your support is greatly appreciated!

Bài đăng liên quan
Thông báo miễn trừ trách nhiệm
Thông tin và các ấn phẩm này không nhằm mục đích, và không cấu thành, lời khuyên hoặc khuyến nghị về tài chính, đầu tư, giao dịch hay các loại khác do TradingView cung cấp hoặc xác nhận. Đọc thêm tại Điều khoản Sử dụng.
Bài đăng liên quan
Thông báo miễn trừ trách nhiệm
Thông tin và các ấn phẩm này không nhằm mục đích, và không cấu thành, lời khuyên hoặc khuyến nghị về tài chính, đầu tư, giao dịch hay các loại khác do TradingView cung cấp hoặc xác nhận. Đọc thêm tại Điều khoản Sử dụng.