Long
EB - texbook chart
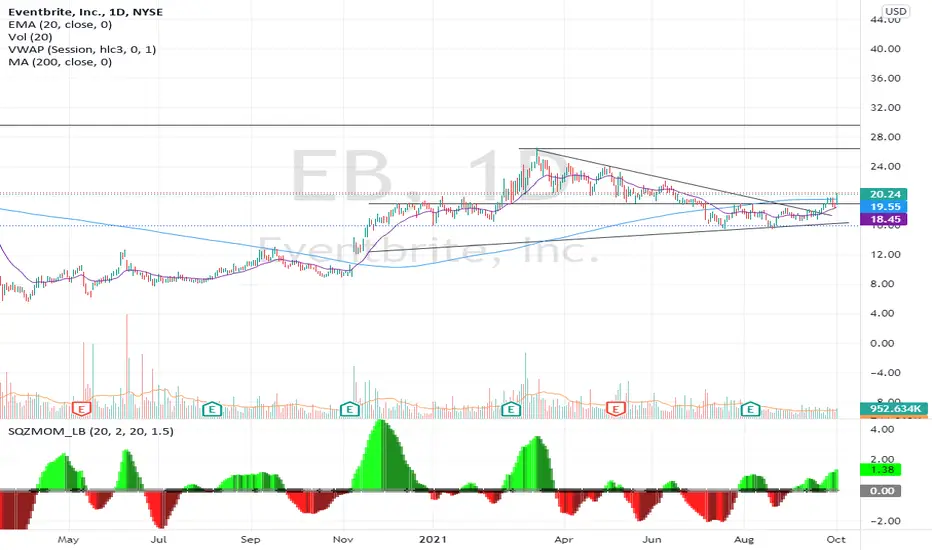
I went through a lot of charts this weekend. Most of them look choppy and ugly which is not surprising with this choppy market.
Picked this one which looks really healthy.
Just left the March-to-September downtrend, went above the strong level at 19.
Then made a healthy pull back, still hold arond the level. Yesterday - nice breakout.
MACD. RSI - positive
Weekly chart: breaking out from a wedge
Stop loss 18.40
Target 25
Picked this one which looks really healthy.
Just left the March-to-September downtrend, went above the strong level at 19.
Then made a healthy pull back, still hold arond the level. Yesterday - nice breakout.
MACD. RSI - positive
Weekly chart: breaking out from a wedge
Stop loss 18.40
Target 25

Thông báo miễn trừ trách nhiệm
Thông tin và các ấn phẩm này không nhằm mục đích, và không cấu thành, lời khuyên hoặc khuyến nghị về tài chính, đầu tư, giao dịch hay các loại khác do TradingView cung cấp hoặc xác nhận. Đọc thêm tại Điều khoản Sử dụng.
Thông báo miễn trừ trách nhiệm
Thông tin và các ấn phẩm này không nhằm mục đích, và không cấu thành, lời khuyên hoặc khuyến nghị về tài chính, đầu tư, giao dịch hay các loại khác do TradingView cung cấp hoặc xác nhận. Đọc thêm tại Điều khoản Sử dụng.