
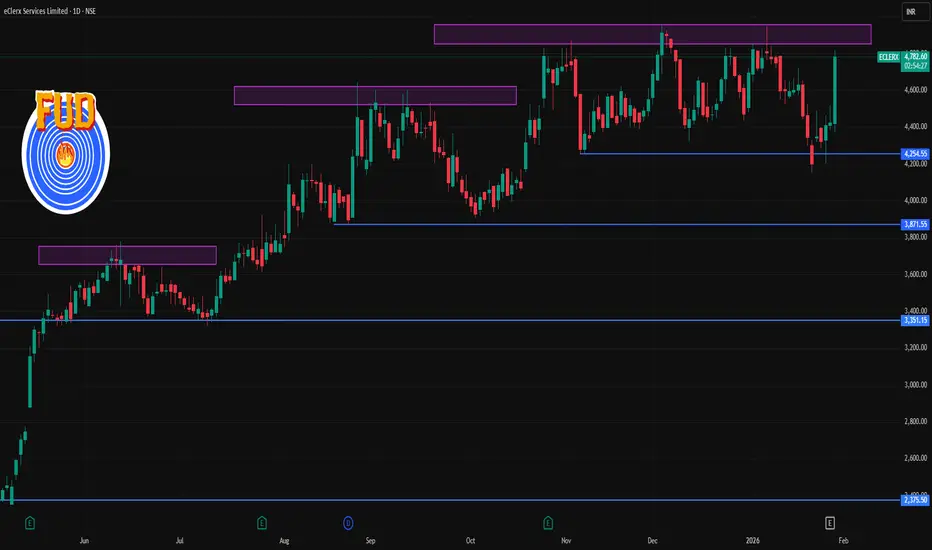
📍 Current Price Snapshot (Daily)
As of the latest available trading data:
• ECLERX daily price: ~₹4,710–₹4,740 region (intraday update) — fluctuating with bullish momentum near recent highs.
📊 Daily Technical Levels (Key Support & Resistance)
Classic Pivot Levels (Daily)
Based on recent pivot calculations from multiple technical sources:
Resistance
R3: ~₹4,748
R2: ~₹4,710–₹4,687
R1: ~₹4,626–₹4,649
Pivot Point: ~₹4,649
Support
S1: ~₹4,588–₹4,588
S2: ~₹4,561–₹4,611
S3: ~₹4,565 and lower
(values approximate based on classic & fibonacci pivot methods)
Simplified pivot zone (short)
Resistance Zone: ~₹4,710–₹4,750
Support Zone: ~₹4,560–₹4,590
Major pivot: ~₹4,648 (neutral decision level)
Additional Support / Resistance Levels (Alternate Sources)
From trendlyne / pivot screens:
• First Resistance: ~₹4,386–₹4,451
• Second Resistance: ~₹4,550–₹4,555
• Third Resistance: ~₹4,621–₹4,622
• Support Zones: ~₹4,254–₹4,215 and deeper ~₹4,161–₹4,111 if broader pullbacks occur.
👉 These can be useful as secondary trigger levels if price action tests below pivot or breaks above immediate resistance.
📌 How to Use These Levels Today
Bullish bias
➡ A daily close above ₹4,710–₹4,750 resistance cluster suggests continuation toward recent highs (potential next zone in higher time frames).
Bearish/Correction risk
➡ Weak price action below ₹4,590–₹4,560 support on the daily can expose the next support band around ₹4,500–₹4,450.
Key pivot confirmation
➡ The central range around ₹4,640–₹4,650 serves as a daily pivot — sustained trading above supports bullish control, below introduces caution.
As of the latest available trading data:
• ECLERX daily price: ~₹4,710–₹4,740 region (intraday update) — fluctuating with bullish momentum near recent highs.
📊 Daily Technical Levels (Key Support & Resistance)
Classic Pivot Levels (Daily)
Based on recent pivot calculations from multiple technical sources:
Resistance
R3: ~₹4,748
R2: ~₹4,710–₹4,687
R1: ~₹4,626–₹4,649
Pivot Point: ~₹4,649
Support
S1: ~₹4,588–₹4,588
S2: ~₹4,561–₹4,611
S3: ~₹4,565 and lower
(values approximate based on classic & fibonacci pivot methods)
Simplified pivot zone (short)
Resistance Zone: ~₹4,710–₹4,750
Support Zone: ~₹4,560–₹4,590
Major pivot: ~₹4,648 (neutral decision level)
Additional Support / Resistance Levels (Alternate Sources)
From trendlyne / pivot screens:
• First Resistance: ~₹4,386–₹4,451
• Second Resistance: ~₹4,550–₹4,555
• Third Resistance: ~₹4,621–₹4,622
• Support Zones: ~₹4,254–₹4,215 and deeper ~₹4,161–₹4,111 if broader pullbacks occur.
👉 These can be useful as secondary trigger levels if price action tests below pivot or breaks above immediate resistance.
📌 How to Use These Levels Today
Bullish bias
➡ A daily close above ₹4,710–₹4,750 resistance cluster suggests continuation toward recent highs (potential next zone in higher time frames).
Bearish/Correction risk
➡ Weak price action below ₹4,590–₹4,560 support on the daily can expose the next support band around ₹4,500–₹4,450.
Key pivot confirmation
➡ The central range around ₹4,640–₹4,650 serves as a daily pivot — sustained trading above supports bullish control, below introduces caution.

Contact Knowledgehub for a detailed consultation: Dm on WhatsApp: [wa.link/a2o0kz]-
Phone No: [+91 93102 26243]-
Email: [tradingviewknowledgehub@gmail.com]---
-- Let’s achieve success together!
Phone No: [+91 93102 26243]-
Email: [tradingviewknowledgehub@gmail.com]---
-- Let’s achieve success together!
Bài đăng liên quan
Thông báo miễn trừ trách nhiệm
Thông tin và các ấn phẩm này không nhằm mục đích, và không cấu thành, lời khuyên hoặc khuyến nghị về tài chính, đầu tư, giao dịch hay các loại khác do TradingView cung cấp hoặc xác nhận. Đọc thêm tại Điều khoản Sử dụng.
Contact Knowledgehub for a detailed consultation: Dm on WhatsApp: [wa.link/a2o0kz]-
Phone No: [+91 93102 26243]-
Email: [tradingviewknowledgehub@gmail.com]---
-- Let’s achieve success together!
Phone No: [+91 93102 26243]-
Email: [tradingviewknowledgehub@gmail.com]---
-- Let’s achieve success together!
Bài đăng liên quan
Thông báo miễn trừ trách nhiệm
Thông tin và các ấn phẩm này không nhằm mục đích, và không cấu thành, lời khuyên hoặc khuyến nghị về tài chính, đầu tư, giao dịch hay các loại khác do TradingView cung cấp hoặc xác nhận. Đọc thêm tại Điều khoản Sử dụng.