Giá xuống
ARSHAM- EOSUSDT DAILY CHART
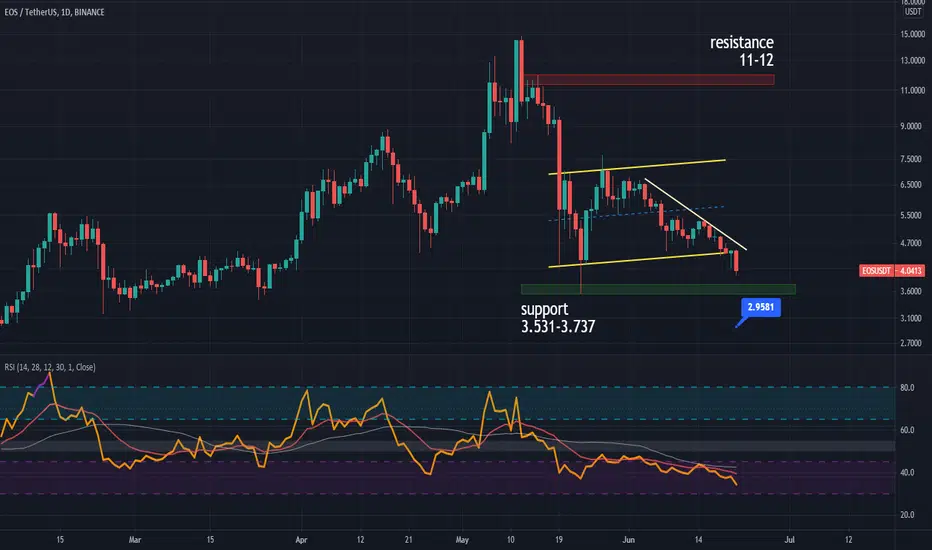
EOS was on a channel but it reached the end of the channel and was not supported there and now it has been able to break the bottom of the channel as well.
and we have support area at 3.531$.
if it is supported there it will try to break the resistance of the channel floor again and enter the channel again but if EOS is not supported t will see 2.95$ and also in the chart when we used RSI we did not see any divergence in it
please share youre idea in comment
and follow me
dont forget like
and we have support area at 3.531$.
if it is supported there it will try to break the resistance of the channel floor again and enter the channel again but if EOS is not supported t will see 2.95$ and also in the chart when we used RSI we did not see any divergence in it
please share youre idea in comment
and follow me
dont forget like

Thông báo miễn trừ trách nhiệm
Thông tin và các ấn phẩm này không nhằm mục đích, và không cấu thành, lời khuyên hoặc khuyến nghị về tài chính, đầu tư, giao dịch hay các loại khác do TradingView cung cấp hoặc xác nhận. Đọc thêm tại Điều khoản Sử dụng.
Thông báo miễn trừ trách nhiệm
Thông tin và các ấn phẩm này không nhằm mục đích, và không cấu thành, lời khuyên hoặc khuyến nghị về tài chính, đầu tư, giao dịch hay các loại khác do TradingView cung cấp hoặc xác nhận. Đọc thêm tại Điều khoản Sử dụng.