
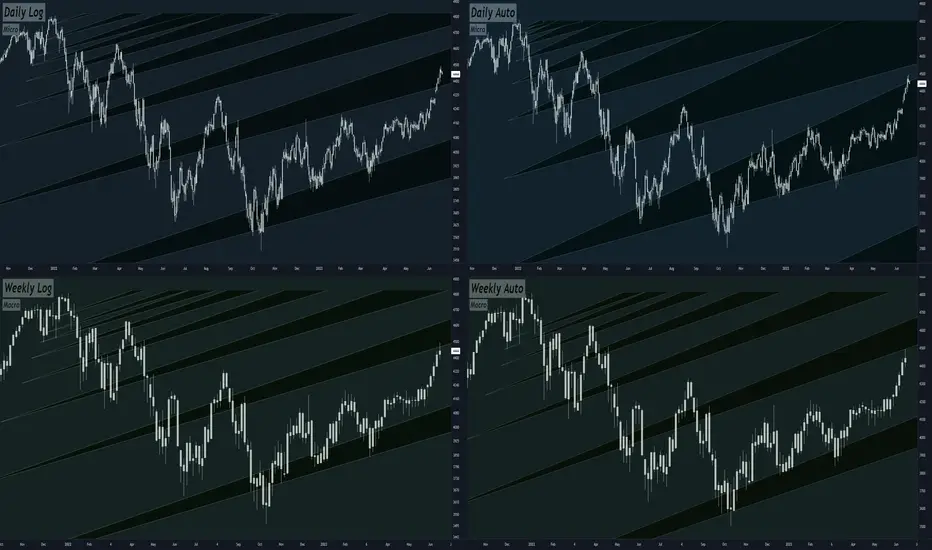
-Here's my quad chart analysis of ES1!, the S&P500 futures index, displaying striking accuracy with Fibonacci retracements.
-The top two boxes present micro charts on daily tf's, showing recent Fibonacci-based peaks and troughs. The bottom two are weekly schematics on 3 Day tf's, revealing longer-term trends obediently following Fib levels.
-KEEP IN MIND THE BOTTOM TWO "WEEKLY" ARE ACTUALLY 3 DAY CHARTS MAPPING A WEEKLY SCHEMATIC
-This alignment suggests the Market Maker's playful maneuvers before an anticipated significant move. Based on the patterns, I hypothesize a considerable downtrend on the horizon for the S&P Futures Index (ES1!).
-Remember, market predictions aren't set in stone and require vigilance. However... dump city here we come.
-The top two boxes present micro charts on daily tf's, showing recent Fibonacci-based peaks and troughs. The bottom two are weekly schematics on 3 Day tf's, revealing longer-term trends obediently following Fib levels.
-KEEP IN MIND THE BOTTOM TWO "WEEKLY" ARE ACTUALLY 3 DAY CHARTS MAPPING A WEEKLY SCHEMATIC
-This alignment suggests the Market Maker's playful maneuvers before an anticipated significant move. Based on the patterns, I hypothesize a considerable downtrend on the horizon for the S&P Futures Index (ES1!).
-Remember, market predictions aren't set in stone and require vigilance. However... dump city here we come.
Ghi chú
Ghi chú

Bài đăng liên quan
Thông báo miễn trừ trách nhiệm
Thông tin và các ấn phẩm này không nhằm mục đích, và không cấu thành, lời khuyên hoặc khuyến nghị về tài chính, đầu tư, giao dịch hay các loại khác do TradingView cung cấp hoặc xác nhận. Đọc thêm tại Điều khoản Sử dụng.
Bài đăng liên quan
Thông báo miễn trừ trách nhiệm
Thông tin và các ấn phẩm này không nhằm mục đích, và không cấu thành, lời khuyên hoặc khuyến nghị về tài chính, đầu tư, giao dịch hay các loại khác do TradingView cung cấp hoặc xác nhận. Đọc thêm tại Điều khoản Sử dụng.