
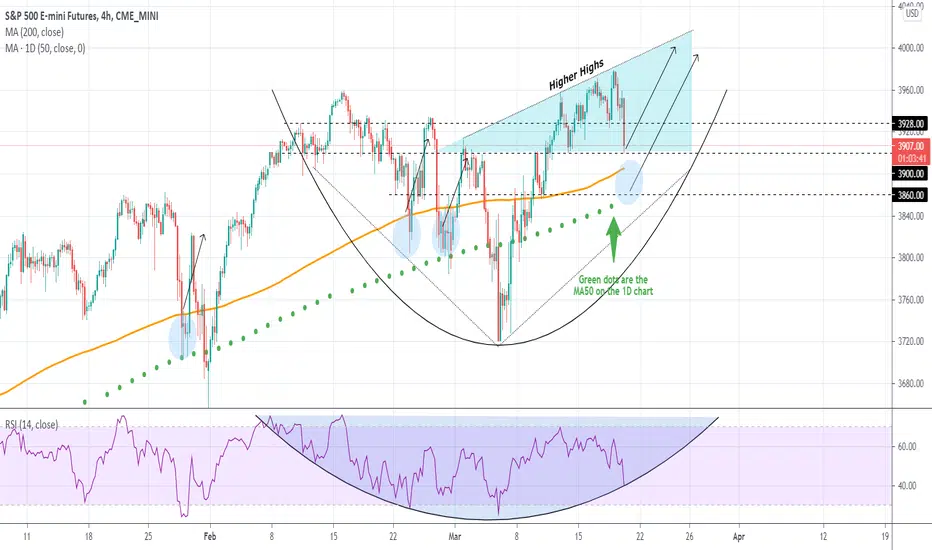
The 4H MA200 (orange trend-line) with the 1D MA50 (green dots) have recently provided rebounds on S&P500 more often than not, acting as a Support Zone.
As you see on the chart those happen to be also on key horizontal Support levels (3900 - 3860). With the 4H RSI making contact with its parabolic line, it is possible that the index is nearing a Support that will provide at least a short-term rebound. Use the Higher Highs line for a potential Target.
** Please support this idea with your likes and comments, it is the best way to keep it relevant and support me. **
--------------------------------------------------------------------------------------------------------
!! Donations via TradingView coins also help me a great deal at posting more free trading content and signals here !!
🎉 👍 Shout-out to TradingShot's 💰 top TradingView Coin donor 💰 this week ==> xBTala
--------------------------------------------------------------------------------------------------------

🚀 I Trade Crypto, Stocks, Indices & Commodities on Bitbase | 1k+ pairs,Low fees,One account! Signup👉 bitbase.com/pro/TRADINGSHOT
💰Message me @ t.me/tradingshot for Account Management|+20% monthly profit| Min. capital $30k|Low Risk
💰Message me @ t.me/tradingshot for Account Management|+20% monthly profit| Min. capital $30k|Low Risk
Thông báo miễn trừ trách nhiệm
Thông tin và các ấn phẩm này không nhằm mục đích, và không cấu thành, lời khuyên hoặc khuyến nghị về tài chính, đầu tư, giao dịch hay các loại khác do TradingView cung cấp hoặc xác nhận. Đọc thêm tại Điều khoản Sử dụng.