
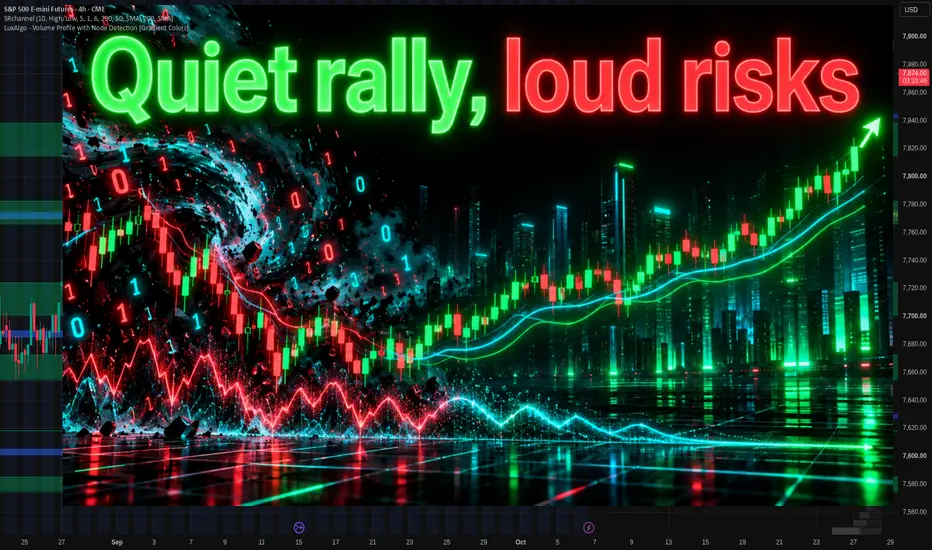
Average True Range (ATR) helps put stop distance in the context of recent volatility. A fixed distance can leave plenty of room in a quiet market yet sit inside ordinary price fluctuations in a more volatile one. The transferable method is to assess the stop against both chart structure and ATR, then adjust position size to keep the planned monetary risk within a defined budget.
First, understand the measurement. True range takes the largest of the candle's high-to-low range and the distances from the previous close to the current high or low. This captures gaps as well as movement within a candle. ATR averages that measure over its lookback. In the supplied S&P 500 E-mini futures example, ATR(14) on the four-hour chart is 29 points, or 0.36%. That describes recent range per four-hour candle; it is neither an average daily move nor a maximum possible move.
Next, observe where the trade idea would become invalid. The supplied context identifies 7747-7781 as an area of interest supported by the largest volume-profile shelf and chart extremes, with 7724 as the illustrative invalidation level beyond the zone. For this exercise, any hypothetical entry is assessed from that zone. The distance to invalidation depends on the actual assumed entry within it, so the zone alone does not define a single stop distance.
Then check the distance in volatility terms:
- Stop distance = absolute difference between the hypothetical entry and stop.
- Stop distance in ATR units = stop distance divided by 29.
- Planned risk per contract = stop distance multiplied by the contract's monetary value per point, with an allowance for costs and slippage.
- Position size must fit that risk per contract within the chosen monetary risk budget.
A strategy can use a tested ATR multiple to assess whether a structural stop has enough room for typical fluctuations. There is no universally correct multiple. As volatility rises, a comparable volatility allowance generally requires a wider stop and smaller position. Lower volatility may support a narrower allowance, but chart invalidation still matters. If the minimum contract size exceeds the risk budget, the example is unsuitable for that budget.
A common mistake is treating rising ATR as a bullish or bearish signal. ATR measures movement magnitude without indicating direction. It also reacts to past price action, so sudden volatility can exceed what the reading suggests.
Practice on historical examples: record ATR, choose a hypothetical entry within the marked zone, calculate the distance to structural invalidation in ATR units, and size the position on paper. Compare examples with different volatility conditions using the same monetary risk budget. Set the rules before revealing subsequent candles, and allow for the possibility that a stop fills beyond its intended price.
First, understand the measurement. True range takes the largest of the candle's high-to-low range and the distances from the previous close to the current high or low. This captures gaps as well as movement within a candle. ATR averages that measure over its lookback. In the supplied S&P 500 E-mini futures example, ATR(14) on the four-hour chart is 29 points, or 0.36%. That describes recent range per four-hour candle; it is neither an average daily move nor a maximum possible move.
Next, observe where the trade idea would become invalid. The supplied context identifies 7747-7781 as an area of interest supported by the largest volume-profile shelf and chart extremes, with 7724 as the illustrative invalidation level beyond the zone. For this exercise, any hypothetical entry is assessed from that zone. The distance to invalidation depends on the actual assumed entry within it, so the zone alone does not define a single stop distance.
Then check the distance in volatility terms:
- Stop distance = absolute difference between the hypothetical entry and stop.
- Stop distance in ATR units = stop distance divided by 29.
- Planned risk per contract = stop distance multiplied by the contract's monetary value per point, with an allowance for costs and slippage.
- Position size must fit that risk per contract within the chosen monetary risk budget.
A strategy can use a tested ATR multiple to assess whether a structural stop has enough room for typical fluctuations. There is no universally correct multiple. As volatility rises, a comparable volatility allowance generally requires a wider stop and smaller position. Lower volatility may support a narrower allowance, but chart invalidation still matters. If the minimum contract size exceeds the risk budget, the example is unsuitable for that budget.
A common mistake is treating rising ATR as a bullish or bearish signal. ATR measures movement magnitude without indicating direction. It also reacts to past price action, so sudden volatility can exceed what the reading suggests.
Practice on historical examples: record ATR, choose a hypothetical entry within the marked zone, calculate the distance to structural invalidation in ATR units, and size the position on paper. Compare examples with different volatility conditions using the same monetary risk budget. Set the rules before revealing subsequent candles, and allow for the possibility that a stop fills beyond its intended price.

SIGNAL INDICATOR
NO REDESIGNING
✅Buy&Sell according to 7 strategies
✅Technical analysis according to 30+ parameters
✅WinRate of signals up to 75%
✅RR 1k3, no deep drawdowns!
Free test drive using my link:
👉midas-club.com/go/tla
NO REDESIGNING
✅Buy&Sell according to 7 strategies
✅Technical analysis according to 30+ parameters
✅WinRate of signals up to 75%
✅RR 1k3, no deep drawdowns!
Free test drive using my link:
👉midas-club.com/go/tla
Thông báo miễn trừ trách nhiệm
Thông tin và các ấn phẩm này không nhằm mục đích, và không cấu thành, lời khuyên hoặc khuyến nghị về tài chính, đầu tư, giao dịch hay các loại khác do TradingView cung cấp hoặc xác nhận. Đọc thêm tại Điều khoản Sử dụng.
SIGNAL INDICATOR
NO REDESIGNING
✅Buy&Sell according to 7 strategies
✅Technical analysis according to 30+ parameters
✅WinRate of signals up to 75%
✅RR 1k3, no deep drawdowns!
Free test drive using my link:
👉midas-club.com/go/tla
NO REDESIGNING
✅Buy&Sell according to 7 strategies
✅Technical analysis according to 30+ parameters
✅WinRate of signals up to 75%
✅RR 1k3, no deep drawdowns!
Free test drive using my link:
👉midas-club.com/go/tla
Thông báo miễn trừ trách nhiệm
Thông tin và các ấn phẩm này không nhằm mục đích, và không cấu thành, lời khuyên hoặc khuyến nghị về tài chính, đầu tư, giao dịch hay các loại khác do TradingView cung cấp hoặc xác nhận. Đọc thêm tại Điều khoản Sử dụng.