
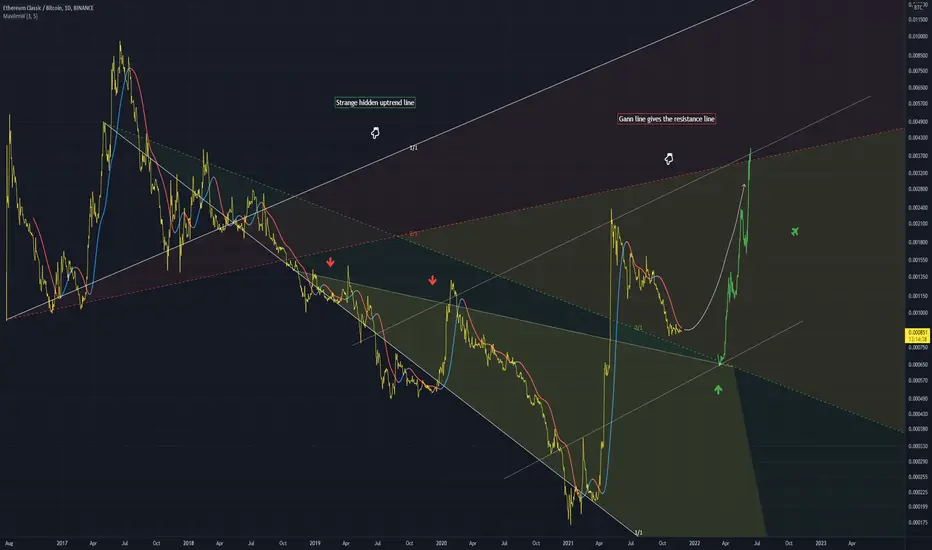
Using the Gann tool we can plot down trends and uptrends
Plotting both, it gives a support point for price, and also a resistance point
I expect a bounce off the support from the downtrend Gann line at some point
This bounce will hit the resistance Gann line (in red)
A large up channel can also be plotted if you place this up move (dotted line)
The indicator is what I expect will occur as price moves (in white)

Thông báo miễn trừ trách nhiệm
Thông tin và các ấn phẩm này không nhằm mục đích, và không cấu thành, lời khuyên hoặc khuyến nghị về tài chính, đầu tư, giao dịch hay các loại khác do TradingView cung cấp hoặc xác nhận. Đọc thêm tại Điều khoản Sử dụng.
Thông báo miễn trừ trách nhiệm
Thông tin và các ấn phẩm này không nhằm mục đích, và không cấu thành, lời khuyên hoặc khuyến nghị về tài chính, đầu tư, giao dịch hay các loại khác do TradingView cung cấp hoặc xác nhận. Đọc thêm tại Điều khoản Sử dụng.