
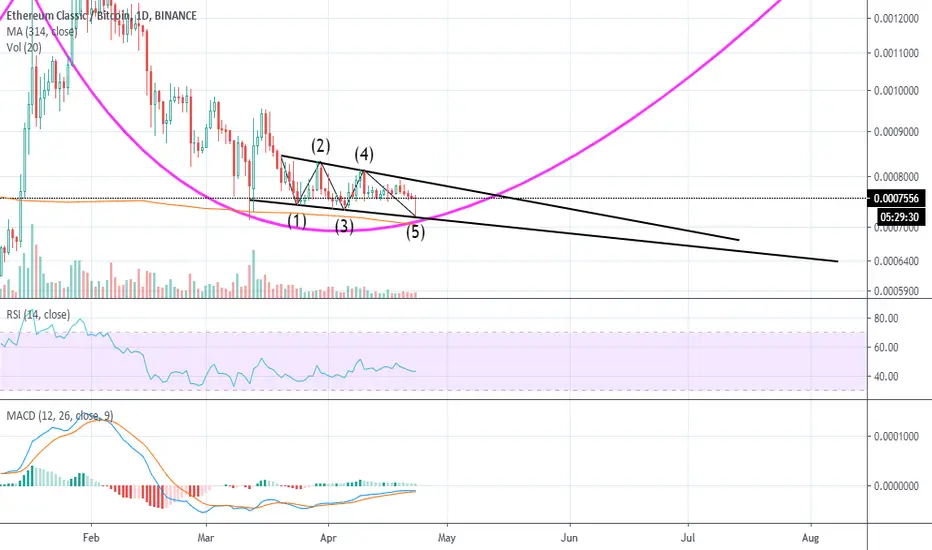
By looking at the chart we can notice a couple of important things:
1) there is a descending channel with 5 waves
2) there is clear bullish divergence
3) formation of dragonfly doji candle on the daily
These are clearly bullish signs. If etc picks momentum the price could skyrocket from here. Especially if it touches that upper resistance line ( the neckline of the big inverse head and shoulders not shown on the chart). This could eventually result in being one of the lowest entry points for ETC.
As usual this is just for educational purpose, good luck with your trades!
Ghi chú
If it happens that we break up to the upside with momentum, there is a high chance of completing the inverse head and shoulders:
Thông báo miễn trừ trách nhiệm
Thông tin và các ấn phẩm này không nhằm mục đích, và không cấu thành, lời khuyên hoặc khuyến nghị về tài chính, đầu tư, giao dịch hay các loại khác do TradingView cung cấp hoặc xác nhận. Đọc thêm tại Điều khoản Sử dụng.
Thông báo miễn trừ trách nhiệm
Thông tin và các ấn phẩm này không nhằm mục đích, và không cấu thành, lời khuyên hoặc khuyến nghị về tài chính, đầu tư, giao dịch hay các loại khác do TradingView cung cấp hoặc xác nhận. Đọc thêm tại Điều khoản Sử dụng.