
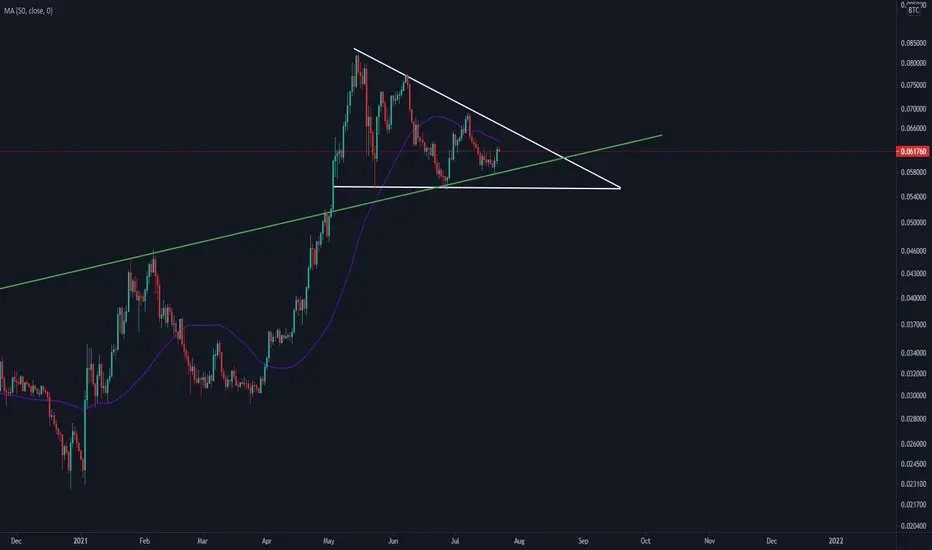
no real analysis here, just wanted to put this chart on everyones radar in case you havent been following. breakout of this pattern will be a massive move for the entire market. a good chart to watch over the next several weeks to gauge the market and make informed decisions mostly relating to your spot wallets, not so much trading. accumulating alt coins when the market is at a tipping point can sometimes be risky, so if anyone is holding a large amount of alt coins, you should absolutely be watching this chart. i personally am not doing any trading except for a bit of scalp trades while we let the last 48 or so hours manifest itself in the market structure, as we can all clearly see how much has changed in that time. just wanting to put this triangle on everyones radar!
as always, godspeed everyone
as always, godspeed everyone

Thông báo miễn trừ trách nhiệm
Thông tin và các ấn phẩm này không nhằm mục đích, và không cấu thành, lời khuyên hoặc khuyến nghị về tài chính, đầu tư, giao dịch hay các loại khác do TradingView cung cấp hoặc xác nhận. Đọc thêm tại Điều khoản Sử dụng.
Thông báo miễn trừ trách nhiệm
Thông tin và các ấn phẩm này không nhằm mục đích, và không cấu thành, lời khuyên hoặc khuyến nghị về tài chính, đầu tư, giao dịch hay các loại khác do TradingView cung cấp hoặc xác nhận. Đọc thêm tại Điều khoản Sử dụng.