Giá xuống
Bearish Symmetric Triangle Inbound!!
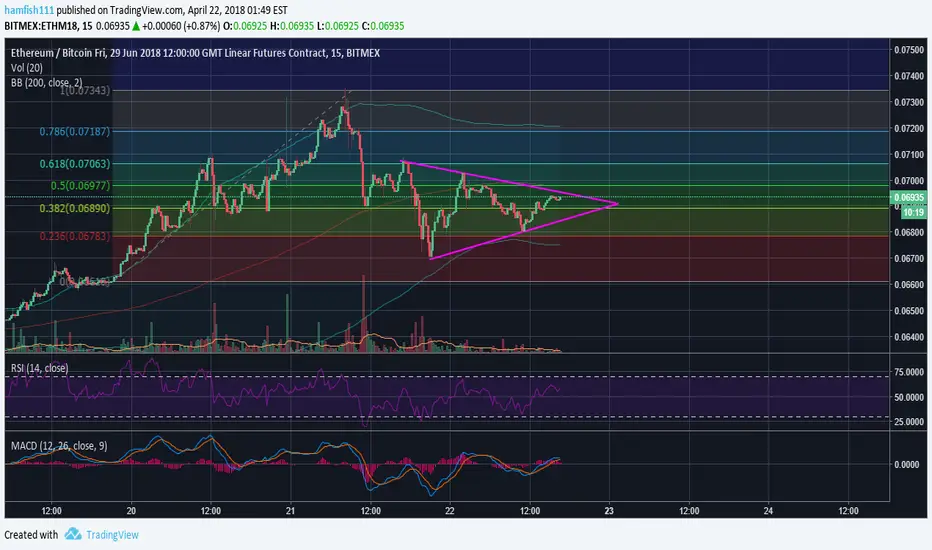
Looking at Ethereum you can see a very noticeable bearish symmetric triangle, some people may get this mixed up with a pennant but the difference between the two is that with a bearish triangle, the price starts from the high point, whereas a pennant starts from the low point.
And also looking at the MACD a crossover seems very possible to the bearish side, and the RSI looks to form a head and shoulders pattern which is also a bearish signal.
Thanks, if you liked my idea dont forget to like it and follow me for more ideas!
And also looking at the MACD a crossover seems very possible to the bearish side, and the RSI looks to form a head and shoulders pattern which is also a bearish signal.
Thanks, if you liked my idea dont forget to like it and follow me for more ideas!
Ghi chú
i dont even understand
Thông báo miễn trừ trách nhiệm
Thông tin và các ấn phẩm này không nhằm mục đích, và không cấu thành, lời khuyên hoặc khuyến nghị về tài chính, đầu tư, giao dịch hay các loại khác do TradingView cung cấp hoặc xác nhận. Đọc thêm tại Điều khoản Sử dụng.
Thông báo miễn trừ trách nhiệm
Thông tin và các ấn phẩm này không nhằm mục đích, và không cấu thành, lời khuyên hoặc khuyến nghị về tài chính, đầu tư, giao dịch hay các loại khác do TradingView cung cấp hoặc xác nhận. Đọc thêm tại Điều khoản Sử dụng.