
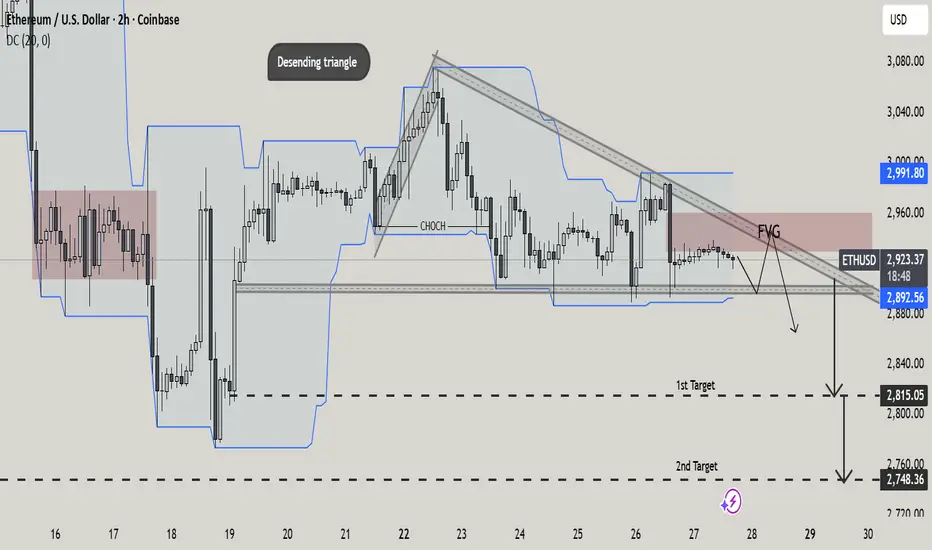
This 2H ETH/USD chart highlights a descending triangle structure forming after a prior impulse move. Price is consistently making lower highs beneath a descending trendline, while holding a horizontal support zone around 2,890–2,900, signaling growing bearish pressure.
A clear CHoCH (Change of Character) confirms the shift in market structure from bullish to bearish. Price is currently trading below key dynamic resistance and within a marked Fair Value Gap (FVG), suggesting a potential rejection area before continuation lower.
The projected downside targets are:
1st Target: ~2,815 (liquidity sweep / prior support)
2nd Target: ~2,748 (major demand zone)
Overall, the chart presents a classic bearish continuation setup, favoring downside expansion if support breaks with confirmation.
A clear CHoCH (Change of Character) confirms the shift in market structure from bullish to bearish. Price is currently trading below key dynamic resistance and within a marked Fair Value Gap (FVG), suggesting a potential rejection area before continuation lower.
The projected downside targets are:
1st Target: ~2,815 (liquidity sweep / prior support)
2nd Target: ~2,748 (major demand zone)
Overall, the chart presents a classic bearish continuation setup, favoring downside expansion if support breaks with confirmation.

telegram channel link
t.me/+4HnhYAZNJ-lhNmY0
join to get daily basis 2-3 free signal for educational purpose
t.me/+4HnhYAZNJ-lhNmY0
you tube channel for trading education
youtube.com/@ALPHA_TRADE_SCOPE
t.me/+4HnhYAZNJ-lhNmY0
join to get daily basis 2-3 free signal for educational purpose
t.me/+4HnhYAZNJ-lhNmY0
you tube channel for trading education
youtube.com/@ALPHA_TRADE_SCOPE
Bài đăng liên quan
Thông báo miễn trừ trách nhiệm
Thông tin và các ấn phẩm này không nhằm mục đích, và không cấu thành, lời khuyên hoặc khuyến nghị về tài chính, đầu tư, giao dịch hay các loại khác do TradingView cung cấp hoặc xác nhận. Đọc thêm tại Điều khoản Sử dụng.
telegram channel link
t.me/+4HnhYAZNJ-lhNmY0
join to get daily basis 2-3 free signal for educational purpose
t.me/+4HnhYAZNJ-lhNmY0
you tube channel for trading education
youtube.com/@ALPHA_TRADE_SCOPE
t.me/+4HnhYAZNJ-lhNmY0
join to get daily basis 2-3 free signal for educational purpose
t.me/+4HnhYAZNJ-lhNmY0
you tube channel for trading education
youtube.com/@ALPHA_TRADE_SCOPE
Bài đăng liên quan
Thông báo miễn trừ trách nhiệm
Thông tin và các ấn phẩm này không nhằm mục đích, và không cấu thành, lời khuyên hoặc khuyến nghị về tài chính, đầu tư, giao dịch hay các loại khác do TradingView cung cấp hoặc xác nhận. Đọc thêm tại Điều khoản Sử dụng.