
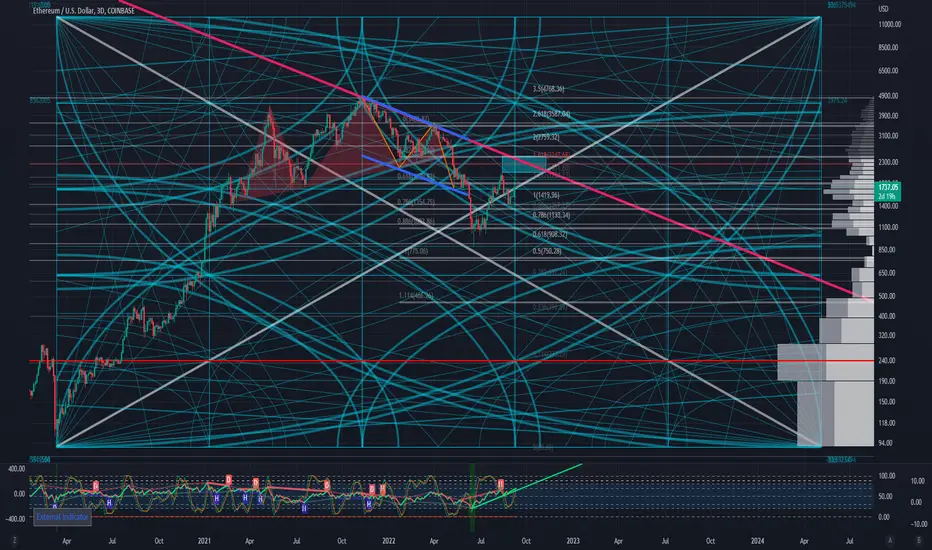
This is an elaboration of my previous idea about the ETH's resistance levels, this time using Gann Square (and arcs).
As can be seen, every arc and fan behaves as support & resistance.
White diagoanl line is Gann 1 x 1. Trends above it are sad to be strong, and trends below it are weak if the square is properly applied.
Overall, this Diagram shows how important but difficult it is for ETH to break through the two key levels: the current price zone and the previous high.
Ghi chú
I attach the linear-scale version of the chart. The main chart is log-scaled.
The linear one is clearer on why I emphasize the resistances.
Ghi chú
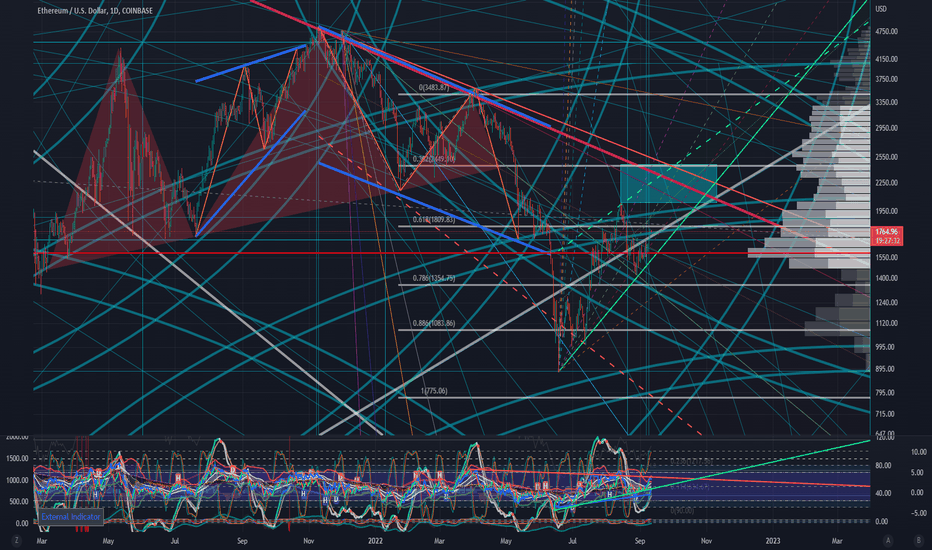
Check out the update.
Visibility improved.

Bài đăng liên quan
Thông báo miễn trừ trách nhiệm
Thông tin và các ấn phẩm này không nhằm mục đích, và không cấu thành, lời khuyên hoặc khuyến nghị về tài chính, đầu tư, giao dịch hay các loại khác do TradingView cung cấp hoặc xác nhận. Đọc thêm tại Điều khoản Sử dụng.
Bài đăng liên quan
Thông báo miễn trừ trách nhiệm
Thông tin và các ấn phẩm này không nhằm mục đích, và không cấu thành, lời khuyên hoặc khuyến nghị về tài chính, đầu tư, giao dịch hay các loại khác do TradingView cung cấp hoặc xác nhận. Đọc thêm tại Điều khoản Sử dụng.