
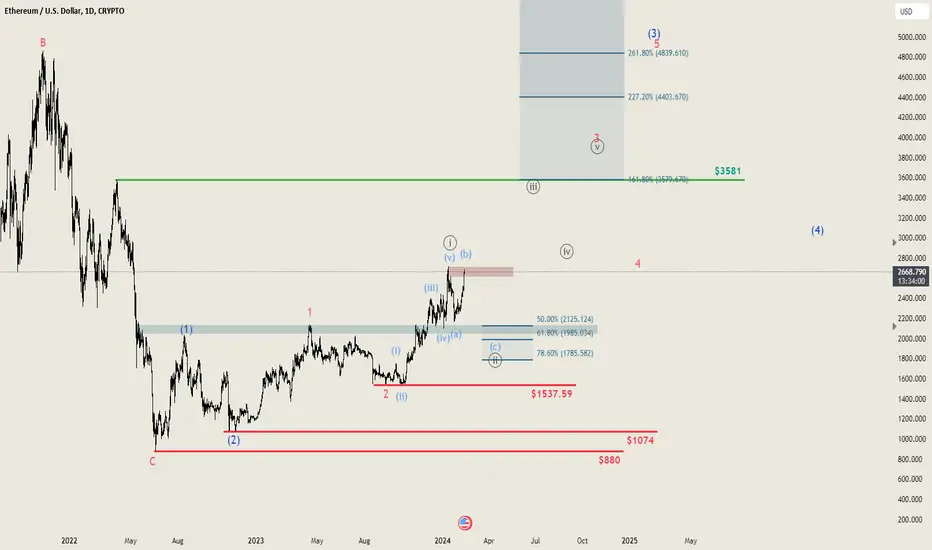
Like other cryptocurrencies, Ethereum has recently experienced a sharp increase that exceeded our expectations, prompting us to reassess our initial scenario. Initially, we anticipated another correction downwards to complete our premiere scenario.
Upon reevaluation of the daily chart, it appears we might be in the overarching blue Wave (3). However, a closer look suggests we've completed the Wave ((i)) and are now facing an ABC correction towards a Wave ((ii)). This assessment is based on the clear structure observed.

The 2-hour chart does not indicate a discernible Wave 2 thus far. Therefore, we presume we're in the correction phase of Wave ((ii)), as long as the $3,000 mark isn't surpassed. Breaking this threshold would necessitate a reevaluation of our scenario, though this is deemed unlikely until the expected correction occurs.
Following this correction, we anticipate that the subordinate Wave 3 of the overarching Wave (3) will reach the $3,580 level. Subsequently, the price should aim for our target range of $4,300 to $5,000.
In summary, as long as we do not exceed the 138% level, namely the $3,000 mark, on the 2-hour chart, we expect a five-part wave structure downward leading to a Wave C/Wave 2.
Upon reevaluation of the daily chart, it appears we might be in the overarching blue Wave (3). However, a closer look suggests we've completed the Wave ((i)) and are now facing an ABC correction towards a Wave ((ii)). This assessment is based on the clear structure observed.
The 2-hour chart does not indicate a discernible Wave 2 thus far. Therefore, we presume we're in the correction phase of Wave ((ii)), as long as the $3,000 mark isn't surpassed. Breaking this threshold would necessitate a reevaluation of our scenario, though this is deemed unlikely until the expected correction occurs.
Following this correction, we anticipate that the subordinate Wave 3 of the overarching Wave (3) will reach the $3,580 level. Subsequently, the price should aim for our target range of $4,300 to $5,000.
In summary, as long as we do not exceed the 138% level, namely the $3,000 mark, on the 2-hour chart, we expect a five-part wave structure downward leading to a Wave C/Wave 2.
Đã hủy lệnh
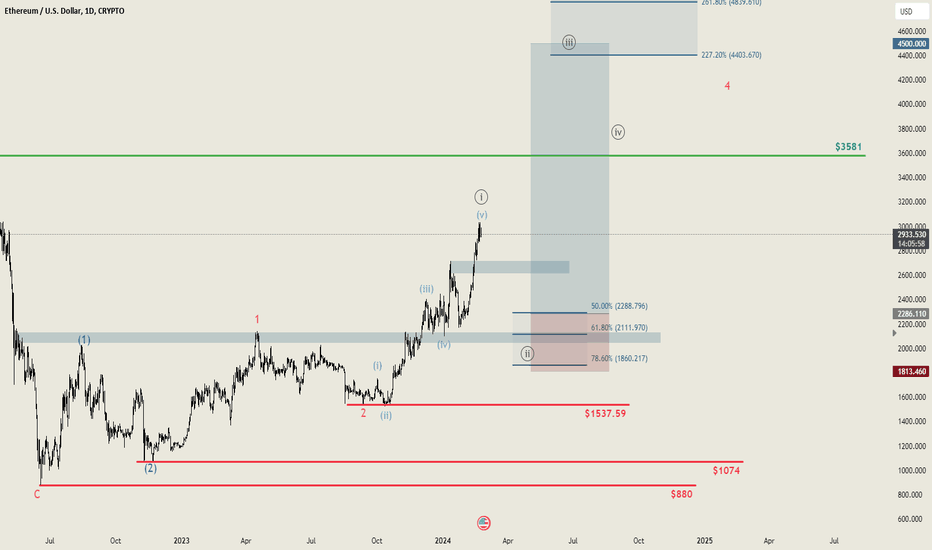
We've changed our scenario, please check the new analysis⬇️⬇️

Bài đăng liên quan
Thông báo miễn trừ trách nhiệm
Thông tin và các ấn phẩm này không nhằm mục đích, và không cấu thành, lời khuyên hoặc khuyến nghị về tài chính, đầu tư, giao dịch hay các loại khác do TradingView cung cấp hoặc xác nhận. Đọc thêm tại Điều khoản Sử dụng.
Bài đăng liên quan
Thông báo miễn trừ trách nhiệm
Thông tin và các ấn phẩm này không nhằm mục đích, và không cấu thành, lời khuyên hoặc khuyến nghị về tài chính, đầu tư, giao dịch hay các loại khác do TradingView cung cấp hoặc xác nhận. Đọc thêm tại Điều khoản Sử dụng.