
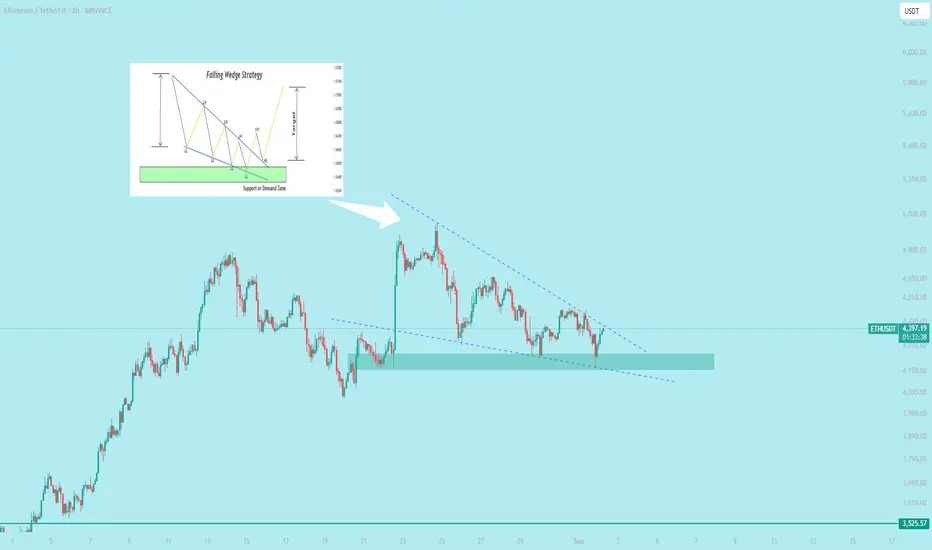
A **falling wedge pattern** is a bullish chart pattern in technical analysis. It forms when the price makes lower highs and lower lows, but the range narrows as the lines converge, creating a wedge shape sloping downward.
**Key Points:**
- **Bullish Signal**: Indicates a potential price reversal or breakout to the upside.
- **Structure**: Two converging trendlines—support (lower) and resistance (upper)—sloping downward.
- **Breakout**: Typically, the price breaks above the upper resistance line, signaling a bullish move.
- **Volume**: Often decreases as the wedge forms, then spikes on breakout.
- **Confirmation**: Wait for a breakout above resistance with strong volume for confirmation.
**Trading Tip**: Enter a long position after the breakout, with a stop-loss below the lower trendline. Target price is often the height of the wedge added to the breakout point.
Example: If Sahara stock shows a falling wedge, watch for a breakout above the upper trendline with high volume for a potential buy signal.
**Key Points:**
- **Bullish Signal**: Indicates a potential price reversal or breakout to the upside.
- **Structure**: Two converging trendlines—support (lower) and resistance (upper)—sloping downward.
- **Breakout**: Typically, the price breaks above the upper resistance line, signaling a bullish move.
- **Volume**: Often decreases as the wedge forms, then spikes on breakout.
- **Confirmation**: Wait for a breakout above resistance with strong volume for confirmation.
**Trading Tip**: Enter a long position after the breakout, with a stop-loss below the lower trendline. Target price is often the height of the wedge added to the breakout point.
Example: If Sahara stock shows a falling wedge, watch for a breakout above the upper trendline with high volume for a potential buy signal.

Thông báo miễn trừ trách nhiệm
Thông tin và các ấn phẩm này không nhằm mục đích, và không cấu thành, lời khuyên hoặc khuyến nghị về tài chính, đầu tư, giao dịch hay các loại khác do TradingView cung cấp hoặc xác nhận. Đọc thêm tại Điều khoản Sử dụng.
Thông báo miễn trừ trách nhiệm
Thông tin và các ấn phẩm này không nhằm mục đích, và không cấu thành, lời khuyên hoặc khuyến nghị về tài chính, đầu tư, giao dịch hay các loại khác do TradingView cung cấp hoặc xác nhận. Đọc thêm tại Điều khoản Sử dụng.