
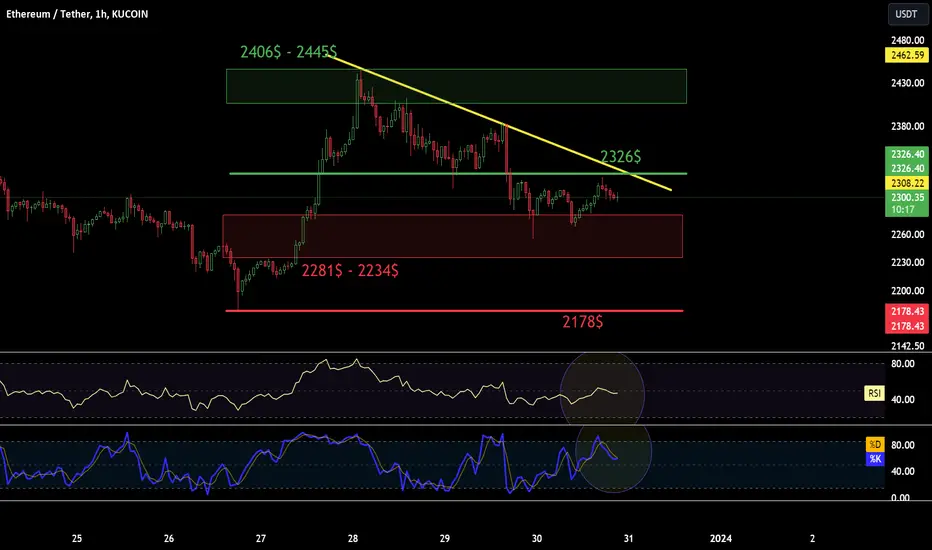
Nearby Supports and Resistances for ETH will support USDT. As you can see, the price remains below the local downtrend line.
After unfolding the Fib Retracement grid, you can see the support zone from $2,281 to $2,234, while there is support at $2,178.
Looking the other way, there is resistance at $2,326, and then there is a strong resistance zone from $2,406 to $2,445.
On the RSi indicator, we returned to the middle of the range, but looking at the STOCH indicator, we can expect a deeper correction.
After unfolding the Fib Retracement grid, you can see the support zone from $2,281 to $2,234, while there is support at $2,178.
Looking the other way, there is resistance at $2,326, and then there is a strong resistance zone from $2,406 to $2,445.
On the RSi indicator, we returned to the middle of the range, but looking at the STOCH indicator, we can expect a deeper correction.

Thông báo miễn trừ trách nhiệm
Thông tin và các ấn phẩm này không nhằm mục đích, và không cấu thành, lời khuyên hoặc khuyến nghị về tài chính, đầu tư, giao dịch hay các loại khác do TradingView cung cấp hoặc xác nhận. Đọc thêm tại Điều khoản Sử dụng.
Thông báo miễn trừ trách nhiệm
Thông tin và các ấn phẩm này không nhằm mục đích, và không cấu thành, lời khuyên hoặc khuyến nghị về tài chính, đầu tư, giao dịch hay các loại khác do TradingView cung cấp hoặc xác nhận. Đọc thêm tại Điều khoản Sử dụng.