
Ethereum (ETH) technical analysis:
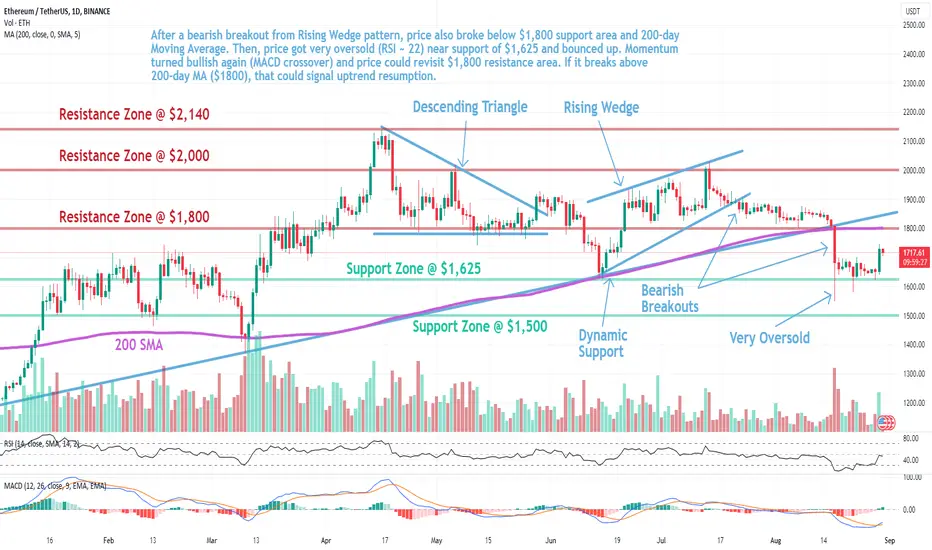
Trade setup: After a bearish breakout from Rising Wedge pattern, price also broke below $1,800 support area and 200-day Moving Average. Then, price got very oversold (RSI ~ 22) near support of $1,625 and bounced up. Momentum turned bullish again (MACD crossover) and price could revisit $1,800 resistance area. If it breaks above 200-day MA ($1800), that could signal uptrend resumption.
Trend: Downtrend across all time horizons (Short- Medium- and Long-Term).
Momentum is Mixed as MACD Line is above MACD Signal Line (Bullish) but RSI ~ 50 (Neutral).
Support and Resistance: Nearest Support Zone is $1,625, then $1,500. The nearest Resistance Zone is $1,800 (previous support), then $2,000 and $2,140.
Trade setup: After a bearish breakout from Rising Wedge pattern, price also broke below $1,800 support area and 200-day Moving Average. Then, price got very oversold (RSI ~ 22) near support of $1,625 and bounced up. Momentum turned bullish again (MACD crossover) and price could revisit $1,800 resistance area. If it breaks above 200-day MA ($1800), that could signal uptrend resumption.
Trend: Downtrend across all time horizons (Short- Medium- and Long-Term).
Momentum is Mixed as MACD Line is above MACD Signal Line (Bullish) but RSI ~ 50 (Neutral).
Support and Resistance: Nearest Support Zone is $1,625, then $1,500. The nearest Resistance Zone is $1,800 (previous support), then $2,000 and $2,140.

Thông báo miễn trừ trách nhiệm
Thông tin và các ấn phẩm này không nhằm mục đích, và không cấu thành, lời khuyên hoặc khuyến nghị về tài chính, đầu tư, giao dịch hay các loại khác do TradingView cung cấp hoặc xác nhận. Đọc thêm tại Điều khoản Sử dụng.
Thông báo miễn trừ trách nhiệm
Thông tin và các ấn phẩm này không nhằm mục đích, và không cấu thành, lời khuyên hoặc khuyến nghị về tài chính, đầu tư, giao dịch hay các loại khác do TradingView cung cấp hoặc xác nhận. Đọc thêm tại Điều khoản Sử dụng.