
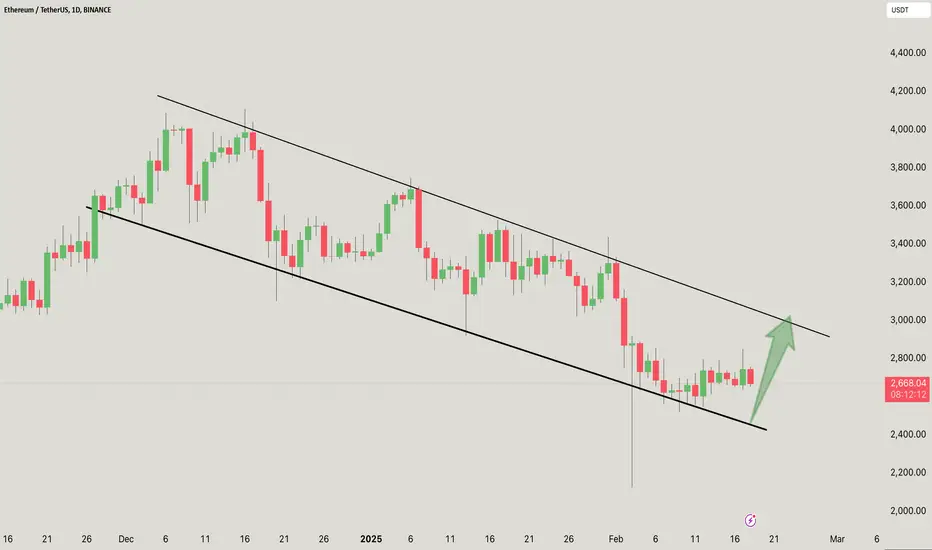
ETH/USDT chart on the daily timeframe is currently in a descending channel. It recently bounced off the lower trendline, indicating a potential short-term bullish reversal. The lower boundary of the channel acts as a strong support level around $2,400-$2,500. The upper trendline of the descending channel, near $3,000, is the next potential resistance. If Ethereum continues this bounce, it could head towards the $3,000 resistance area. A breakout above the channel could signal a trend reversal to the upside, while rejection could push ETH back toward lower support. Keep an eye on volume and price action near resistance levels to confirm the next move.
If you found this analysis helpful, hit the Like button and share your thoughts or questions in the comments below. Your feedback matters!
Thanks for your support!
DYOR. NFA
If you found this analysis helpful, hit the Like button and share your thoughts or questions in the comments below. Your feedback matters!
Thanks for your support!
DYOR. NFA

Bài đăng liên quan
Thông báo miễn trừ trách nhiệm
Thông tin và các ấn phẩm này không nhằm mục đích, và không cấu thành, lời khuyên hoặc khuyến nghị về tài chính, đầu tư, giao dịch hay các loại khác do TradingView cung cấp hoặc xác nhận. Đọc thêm tại Điều khoản Sử dụng.
Bài đăng liên quan
Thông báo miễn trừ trách nhiệm
Thông tin và các ấn phẩm này không nhằm mục đích, và không cấu thành, lời khuyên hoặc khuyến nghị về tài chính, đầu tư, giao dịch hay các loại khác do TradingView cung cấp hoặc xác nhận. Đọc thêm tại Điều khoản Sử dụng.