
Hi Traders,
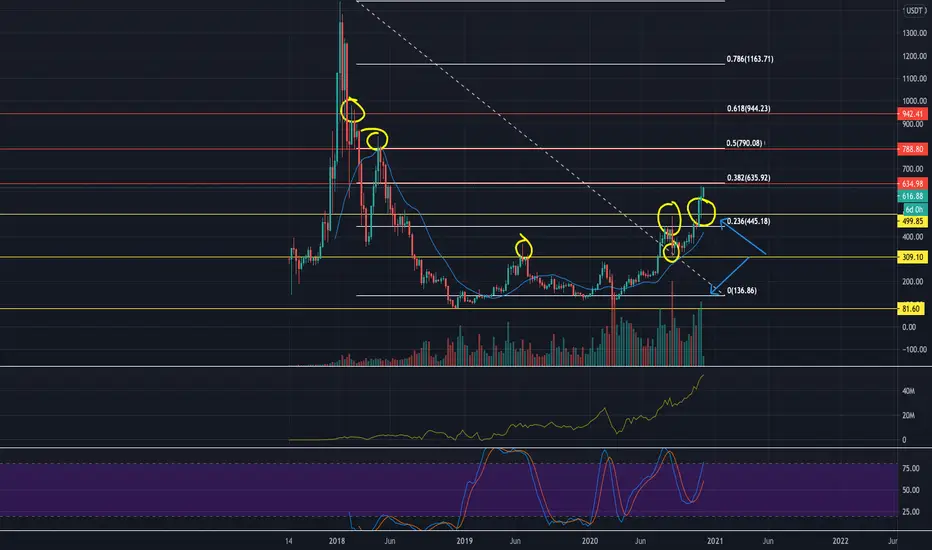
We have here an ETHUSDT chart analysis. We begin by taking a look at the weekly timeframe where we are able to see key levels of supply and demand. The price consolidated between support ($81) and resistance ($309) where it later broke up through the resistance creating a new year all time high ($500) for it to then retrace to our past resistance at ($309).
More recently, we have seen price test this yearly high with volume and accumulation, confirming that it is now support. We have the 0.382 Fib which seems to not have much supply coming into the market which leads to think that it may push to the next level of resistance at $790 which is also the 0.5 Fib.
Thanks
The Market Sniper Team
We have here an ETHUSDT chart analysis. We begin by taking a look at the weekly timeframe where we are able to see key levels of supply and demand. The price consolidated between support ($81) and resistance ($309) where it later broke up through the resistance creating a new year all time high ($500) for it to then retrace to our past resistance at ($309).
More recently, we have seen price test this yearly high with volume and accumulation, confirming that it is now support. We have the 0.382 Fib which seems to not have much supply coming into the market which leads to think that it may push to the next level of resistance at $790 which is also the 0.5 Fib.
Thanks
The Market Sniper Team

Thông báo miễn trừ trách nhiệm
Thông tin và các ấn phẩm này không nhằm mục đích, và không cấu thành, lời khuyên hoặc khuyến nghị về tài chính, đầu tư, giao dịch hay các loại khác do TradingView cung cấp hoặc xác nhận. Đọc thêm tại Điều khoản Sử dụng.
Thông báo miễn trừ trách nhiệm
Thông tin và các ấn phẩm này không nhằm mục đích, và không cấu thành, lời khuyên hoặc khuyến nghị về tài chính, đầu tư, giao dịch hay các loại khác do TradingView cung cấp hoặc xác nhận. Đọc thêm tại Điều khoản Sử dụng.