
Trend & Structure
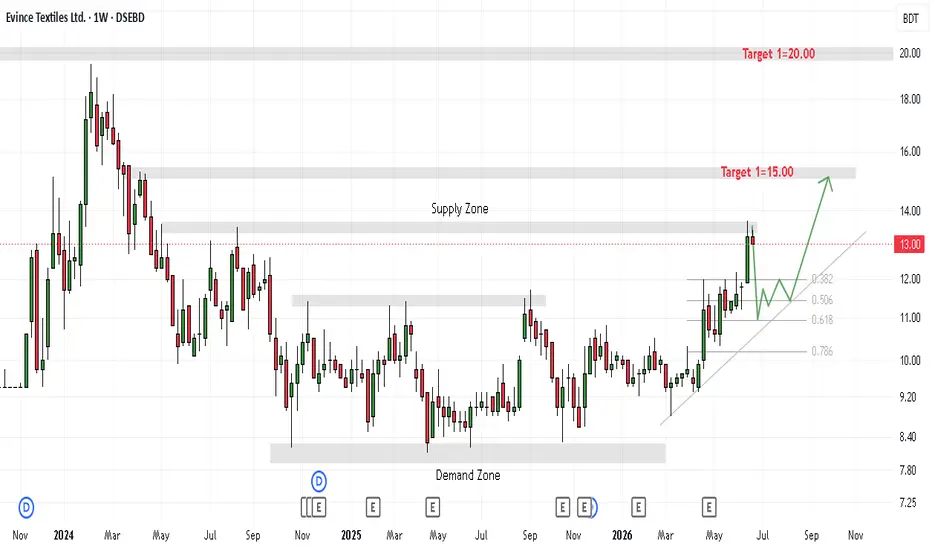
Massive Downtrend (Early 2024 → early 2025): The stock fell from around 17 BDT down to the Demand Zone (~8.50) — a brutal decline of approximately 50%.
Bottoming & Accumulation (2025): Price oscillated within the Demand Zone, forming a base between 8–10 BDT. This is classic accumulation behavior.
Breakout & Uptrend (Late 2025 → Mid 2026): Price broke above the downward trend line (the diagonal line on the chart) and has been making higher highs and higher lows.
Current Price: Appears to be in the 13.50–14.50 range — approaching Target 1.
Fibonacci Analysis
The numbers 0.382, 0.506, 0.618, and 0.786 likely represent Fibonacci retracement levels measured from the highs to the lows of the prior decline. The current rally has already cleared the 0.382 and 0.506 levels, and is now challenging the 0.618–0.786 zone, which aligns with the 14–15 BDT area — a natural resistance cluster.
Outlook
Bullish bias with caution. The chart shows:
Broken trend line — structural shift from downtrend to uptrend
Demand zone respected — strong base formed
Higher lows pattern intact
Approaching Target 1 (15.00) — this is also near the bottom of the Supply Zone, so expect resistance and potential consolidation/pullback here
If 15.00 breaks decisively, Target 2 at 20.00 becomes viable
Risk: If price rejects around 14–15 and falls back below the broken trend line (around 11–12), the breakout could fail. The Demand Zone (8–10) remains the ultimate support to hold for the bullish thesis to remain intact.
Massive Downtrend (Early 2024 → early 2025): The stock fell from around 17 BDT down to the Demand Zone (~8.50) — a brutal decline of approximately 50%.
Bottoming & Accumulation (2025): Price oscillated within the Demand Zone, forming a base between 8–10 BDT. This is classic accumulation behavior.
Breakout & Uptrend (Late 2025 → Mid 2026): Price broke above the downward trend line (the diagonal line on the chart) and has been making higher highs and higher lows.
Current Price: Appears to be in the 13.50–14.50 range — approaching Target 1.
Fibonacci Analysis
The numbers 0.382, 0.506, 0.618, and 0.786 likely represent Fibonacci retracement levels measured from the highs to the lows of the prior decline. The current rally has already cleared the 0.382 and 0.506 levels, and is now challenging the 0.618–0.786 zone, which aligns with the 14–15 BDT area — a natural resistance cluster.
Outlook
Bullish bias with caution. The chart shows:
Broken trend line — structural shift from downtrend to uptrend
Demand zone respected — strong base formed
Higher lows pattern intact
Approaching Target 1 (15.00) — this is also near the bottom of the Supply Zone, so expect resistance and potential consolidation/pullback here
If 15.00 breaks decisively, Target 2 at 20.00 becomes viable
Risk: If price rejects around 14–15 and falls back below the broken trend line (around 11–12), the breakout could fail. The Demand Zone (8–10) remains the ultimate support to hold for the bullish thesis to remain intact.

Thông báo miễn trừ trách nhiệm
Thông tin và các ấn phẩm này không nhằm mục đích, và không cấu thành, lời khuyên hoặc khuyến nghị về tài chính, đầu tư, giao dịch hay các loại khác do TradingView cung cấp hoặc xác nhận. Đọc thêm tại Điều khoản Sử dụng.
Thông báo miễn trừ trách nhiệm
Thông tin và các ấn phẩm này không nhằm mục đích, và không cấu thành, lời khuyên hoặc khuyến nghị về tài chính, đầu tư, giao dịch hay các loại khác do TradingView cung cấp hoặc xác nhận. Đọc thêm tại Điều khoản Sử dụng.