

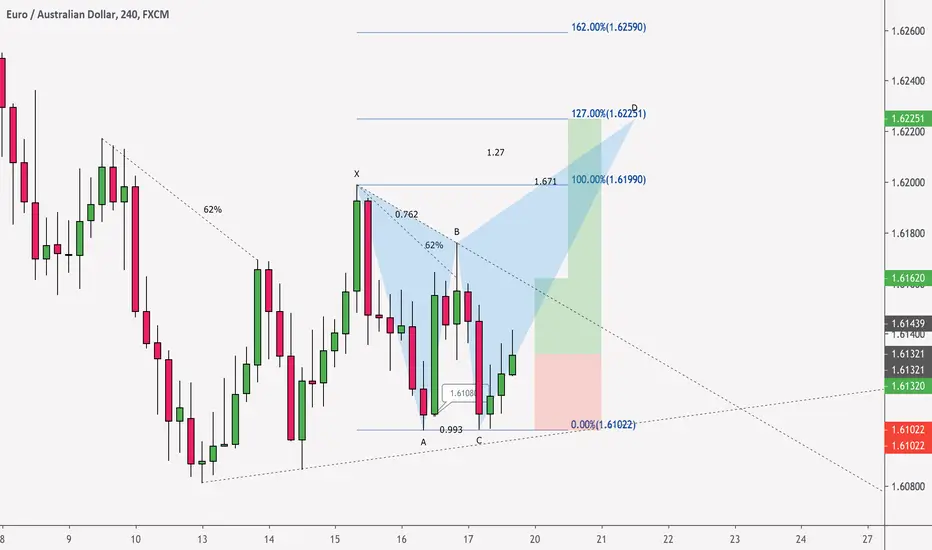
This chart appears to be forming a H&S pattern, but the bearish bias is not confirmed until the neckline has been breached. Until then I will be looking to long the Double Bottom pattern. Considering the 76% retracements there is high probability that price will rally up to complete the Butterfly.
Trendline break from ''XB'' indicates bullish momentum. A break above B confirms the butterfly. If any bullish wide range bars occurs from ''CD'' and/or at ''D'' it would be safe to target 162% XA.
Please leave a like and make sure you comment below with any idea regarding EUR/AUD
Thank you for reading
God bless and happy trading!
Đóng lệnh: đạt mục tiêu

Thông báo miễn trừ trách nhiệm
Thông tin và các ấn phẩm này không nhằm mục đích, và không cấu thành, lời khuyên hoặc khuyến nghị về tài chính, đầu tư, giao dịch hay các loại khác do TradingView cung cấp hoặc xác nhận. Đọc thêm tại Điều khoản Sử dụng.
Thông báo miễn trừ trách nhiệm
Thông tin và các ấn phẩm này không nhằm mục đích, và không cấu thành, lời khuyên hoặc khuyến nghị về tài chính, đầu tư, giao dịch hay các loại khác do TradingView cung cấp hoặc xác nhận. Đọc thêm tại Điều khoản Sử dụng.