

Hi,
Slowly I start to add some mid-term (weeks, months) trading & investment opportunities into my TradingView account.
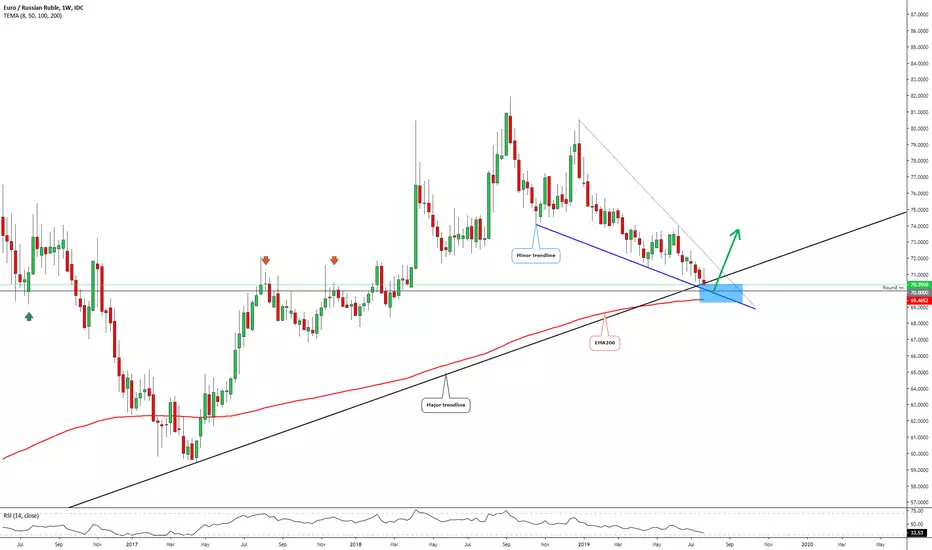
The first one which looks technically pretty nice is EURRUB. Pretty soon you can start building your long position on EURRUB and it starts from the round number 70. Obviously, do your own research, read fundamentals and etc.
Technical criteria are:
1. Previously worked resistance becomes support.
In 2017, this level worked 2 to 3* times as a resistance level. Actually, it has worked also as a support level - in 2016 July and 2015 October-November
2. The round number 70 should act as a support level
3. The black trendlines make this wide support area much stronger
4. Weekly EMA200 acts as a support level.
5. Minor trendline (blue) third touch matching exactly with the blue box. This minor trendline is also a lower trendline from the bullish chart pattern "Falling Wedge". It is just information because patterns are only then valid when the breakout has occurred!
6.(!) Wait for a bullish candlestick formation to be more secure.
As said, do your own research and if this matching with mine then you are ready to build your long position!
Please, take a second to support my effort by hitting the "LIKE" button, it is my only fee from You!
Best regards,
Vaido
Ghi chú
He knows something :)Perfect launch from the marked area!
Đóng lệnh: đạt mục tiêu
Perfect!Area discovered on the beginning of the June, trade executed on the end of the July - Patience Is The Key!

Thông báo miễn trừ trách nhiệm
Thông tin và các ấn phẩm này không nhằm mục đích, và không cấu thành, lời khuyên hoặc khuyến nghị về tài chính, đầu tư, giao dịch hay các loại khác do TradingView cung cấp hoặc xác nhận. Đọc thêm tại Điều khoản Sử dụng.
Thông báo miễn trừ trách nhiệm
Thông tin và các ấn phẩm này không nhằm mục đích, và không cấu thành, lời khuyên hoặc khuyến nghị về tài chính, đầu tư, giao dịch hay các loại khác do TradingView cung cấp hoặc xác nhận. Đọc thêm tại Điều khoản Sử dụng.