

Hi all,
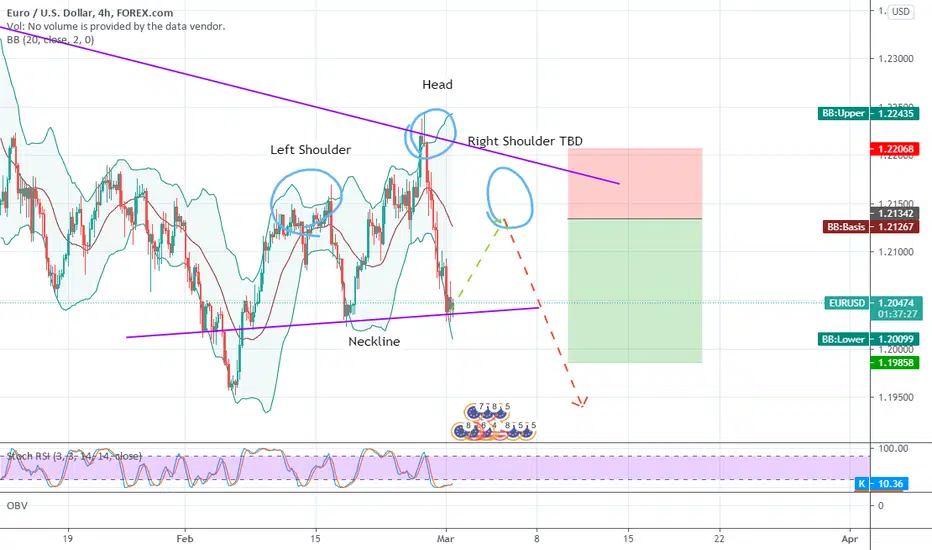
I see a possible 2:1 trade to the downside.
Of course we would need confirmation for this pattern to be valid. But definitely something to watch out for.
Note: The larger trend if you zoom out and look left is bullish. But this is something you can spot on the lower timeframe. In this case the H4 timeframe is a great way to spot good risk to reward trades.
Target Profit range is around the 1.23 Fibonacci extension 1.195-1.200 range and stop loss is above left shoulder resistance dependent on if the right shoulder forms.
P.S.
I am always open to feedback and constructive criticism for my analysis and open to learning from all. Thanks!
---------------------------
Full disclosure: My ideas/opinions are for education and entertainment purposes only. NOT advice or predictions for investment choices. I’m not a certified financial planner/advisor nor a certified financial analyst nor an economist nor a CPA nor an accountant nor a lawyer. I’m not a finance professional through formal education. The contents on this site are for informational and entertainment purposes only and does not constitute financial, accounting, or legal advice. I can’t promise that the information shared on my posts is appropriate for you or anyone else. By using this site, you agree to hold me harmless from any ramifications, financial or otherwise, that occur to you as a result of acting on information found on this site.
---------------------------
I see a possible 2:1 trade to the downside.
Of course we would need confirmation for this pattern to be valid. But definitely something to watch out for.
Note: The larger trend if you zoom out and look left is bullish. But this is something you can spot on the lower timeframe. In this case the H4 timeframe is a great way to spot good risk to reward trades.
Target Profit range is around the 1.23 Fibonacci extension 1.195-1.200 range and stop loss is above left shoulder resistance dependent on if the right shoulder forms.
P.S.
I am always open to feedback and constructive criticism for my analysis and open to learning from all. Thanks!
---------------------------
Full disclosure: My ideas/opinions are for education and entertainment purposes only. NOT advice or predictions for investment choices. I’m not a certified financial planner/advisor nor a certified financial analyst nor an economist nor a CPA nor an accountant nor a lawyer. I’m not a finance professional through formal education. The contents on this site are for informational and entertainment purposes only and does not constitute financial, accounting, or legal advice. I can’t promise that the information shared on my posts is appropriate for you or anyone else. By using this site, you agree to hold me harmless from any ramifications, financial or otherwise, that occur to you as a result of acting on information found on this site.
---------------------------
Ghi chú
Missed right shoulder entry at 1.21. Sell limit did not execute. But this shows the power of technical patterns!

Fei
Thông báo miễn trừ trách nhiệm
Thông tin và các ấn phẩm này không nhằm mục đích, và không cấu thành, lời khuyên hoặc khuyến nghị về tài chính, đầu tư, giao dịch hay các loại khác do TradingView cung cấp hoặc xác nhận. Đọc thêm tại Điều khoản Sử dụng.
Thông báo miễn trừ trách nhiệm
Thông tin và các ấn phẩm này không nhằm mục đích, và không cấu thành, lời khuyên hoặc khuyến nghị về tài chính, đầu tư, giao dịch hay các loại khác do TradingView cung cấp hoặc xác nhận. Đọc thêm tại Điều khoản Sử dụng.